Adding Waveforms and Phase
In the lecture on basic acoustics we examined the time and frequency characteristics of simple waveforms. These waveforms resemble sine waves when plotted and can be characterised by their period (or wavelength), frequency (derivable from wavelength and the speed of sound) and amplitude (or more correctly sound pressure level, measured in Pascals). Such simple waveforms characterise pure tones. A natural source of sounds that closely approximates pure tones is the tuning fork. The vast majority of natural sounds are not pure tones but are complex sounds that can be thought of as the combination of two or more pure tones.
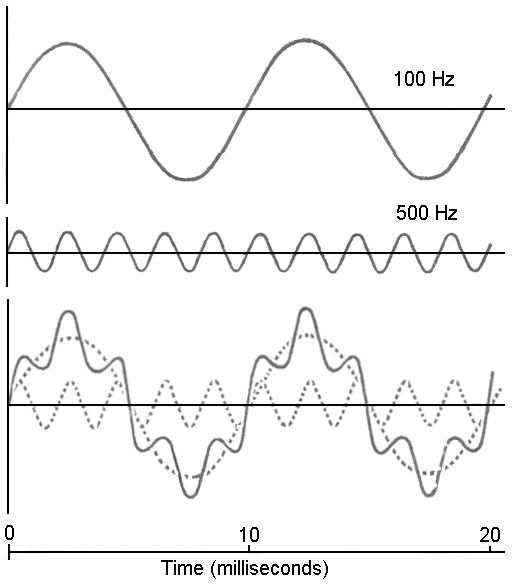
Figure 1: Adding together two pure tones of 100 Hz and 500 Hz (and of different amplitudes). Adapted from: Ladefoged (1962)
In figure 1 we can see the effect of adding two pure tones, one of 100 Hz and the other of 500 Hz. The 500 Hz tone has half the sound pressure level of the 100 Hz tone. In the bottom part of the diagram we can see the two pure tones as dashed lines. A simple addition of the dashed lines results in the unbroken line. The unbroken line clearly has a more complex pattern than either of the two pure tones.
Note that the complex pattern repeats with the same period as the 100 Hz tone. Also note that 100 Hz is the highest common integer factor of the frequencies of the two tones (100 and 500 can both be divided by 100 to produce an integer result - this is also true for smaller factors, such as 50 and 25, but 100 is the highest common factor). The period (and therefore the frequency) of a complex wave is always equal to the period (or frequency) of the highest common factor of the sine waves being added to produce it. The repetition frequency of the complex pattern can be called its fundamental frequency (F0 or F0).
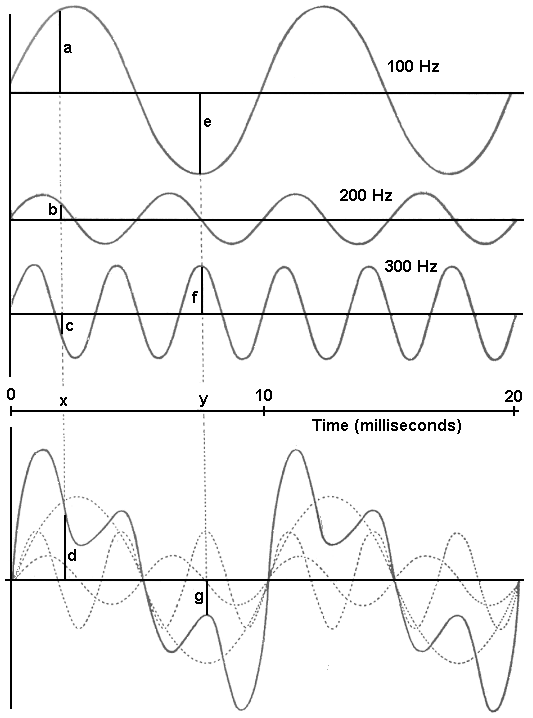
Figure 2: Adding together three pure tones of 100 Hz, 200 Hz and 300 Hz. The first cycles are aligned with zero phase. Adapted from: Ladefoged (1962)
In figure 2 we examine the addition of three pure tones at 100, 200 and 300 Hz but of different amplitudes. These sine waves are said to be aligned with a zero phase angle. That means that they all start at the same position in their cycle. They all start from the 0º position (or 0 radians - recall the simple harmonic motion diagram). That is the point where the cycles begin to increase from a zero amplitude. The highest common factor of 100, 200 and 300 is 100 and so the resultant complex wave has a fundamental frequency of 100 Hz. In the above diagram, at point "x" we add the amplitudes "a", "b" and "c" to obtain amplitude "d" on the complex wave. At point "y" we add the amplitudes "e" and "f" to obtain amplitude "g" on the complex wave (the amplitude of the 200 Hz wave is 0 at point "y").
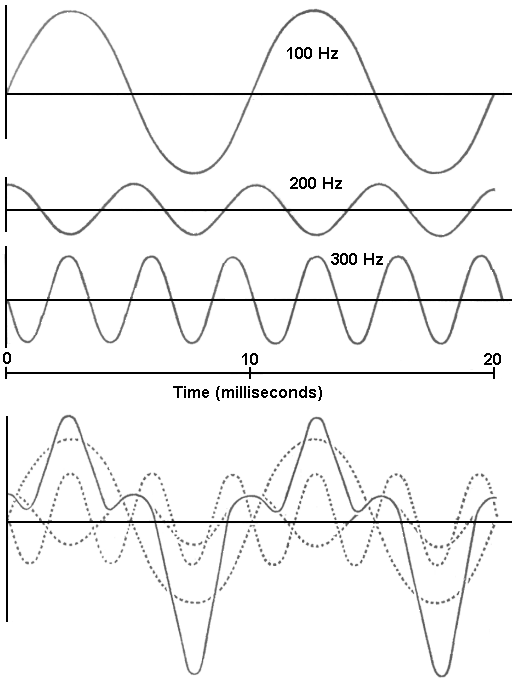
Figure 3: Adding together three pure tones of 100 Hz, 200 Hz and 300 Hz. These are exactly the same pure tones as in figure 2 except that the first cycles are aligned with 0º, 90º and 180º phase. Adapted from: Ladefoged (1962)
In figure 3 we can see the result of adding together exactly the same three pure tones as in figure 2 (that is the same frequency and amplitude), but with non-zero phase relationships. Note how this difference in phase results in a totally different complex wave shape (but still with a 100 Hz frequency). Note that whilst the shapes of the two complex tones in figures 2 and 3 are very different, they are indistinguishable to the human ear. That is, in these types of sounds (sounds with a continuous musical tone) the human ear is insensitive to phase differences. What the ear picks up is the frequency and amplitude characteristics of the tones that were added to create the complex tone.
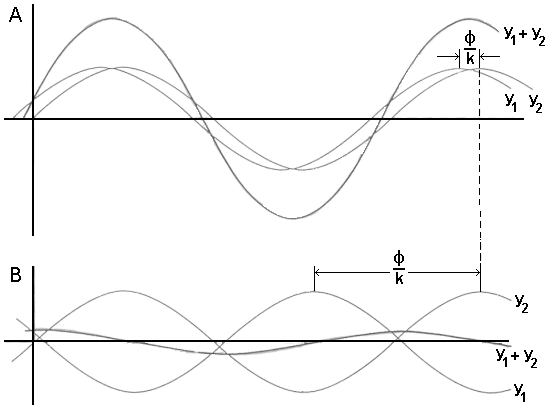
Figure 4: In this figure we have two tones of the same frequency and amplitude, but of different phase relationships added together to produce (A) partial reinforcement and (B) partial cancellation.
In figure 4 we can see that when two tones of the same frequency and amplitude are added together the resultant wave can be either more intense or less intense than either of the original tones. When the resultant sound is more intense we have reinforcement (in this case partial reinforcement) and when the resultant sound is less intense we have cancellation (in this case partial cancellation).
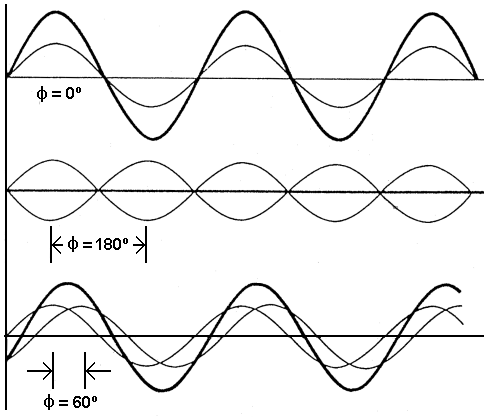
Figure 5: In this figure we have two tones of equal intensity and frequency, but different phase, being added together to produce total reinforcement, total cancellation and partial reinforcement. The two original tones in the upper panel have have a zero phase relationship and therefore are superimposed over each other making it appear like there is only one original tone.
In figure 5 we can see that when two identical tones have a 0º phase relationship we get total reinforcement where the resultant amplitude is exactly twice the original amplitudes. When there is a phase relationship of 180º we get complete cancellation (resultant amplitude is zero - a straight line on the x axis). For all other phase relationships we get either partial cancellation or partial reinforcement (in this case for 60º).
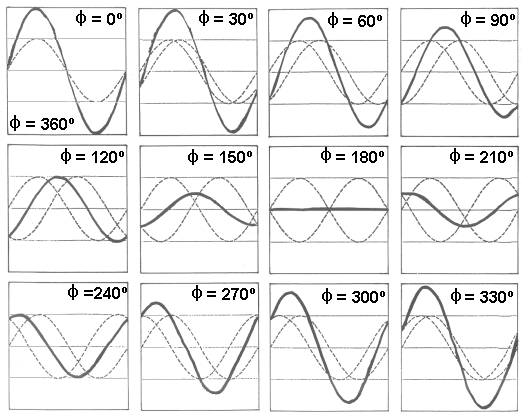
Figure 6: Here we see the effect of the addition of two identical waves (one cycle only) for 12 different phase angles.
Figure 6 illustrates the effect of 12 different phase angles on the addition of two identical waves. Wa can see that we go from complete reinforcement at 0º (completely "in phase") to complete cancellation at 180º (completely "out of phase") then back to complete reinforcment at 360º (same as 0º). Note that we pass through patterns of partial reinforcement and cancellation. At 120º and 240º we get neither cancellation or reinforcement but rather a resultant wave identical to the original waves but with an intermediate phase angle relative to the two original waves.
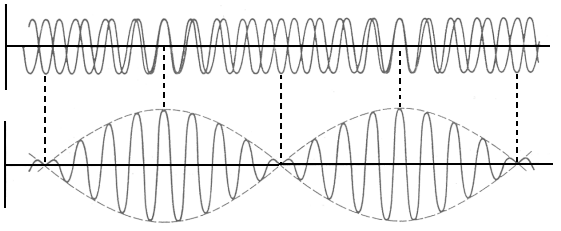
Figure 7: The adding together of two waves that differ only slightly in frequency illustrates "beating".
When we add together two waves that differ only slightly in frequency their highest common factor is much smaller than either frequency. In figure 7 the two original waves differ only slightly in frequency. Two waves of 160 Hz and 170 Hz would approximate the pattern that we see here. The highest common factor of 160 and 170 is 10 and so the resultant pattern repeats with a frequency of only 10 Hz. Note that the frequency of the resultant complex pattern does not need to be the frequency of one of the original tones. When we listen to this pattern we hear the high frequency components as part of the complex quality of the tone but we hear the fundamental frequency of the complex tone as the much lower 10 Hz. As 20 Hz is the lowest frequency that the human ear can fuse into a tonal sound (ie. that we can hear as a tone) then lower frequencies are heard as fluctuations in intensity. A 10 Hz repeating complex wave of the kind that we see in figure 7 would sound like it was fluctuating in intensity 10 times per second. We call this phenomenon "beating" and would say that this complex tone was beating with a frequency of 10 Hz. Beating occurs because successive cycles of the two original waves move into and out of phase and so go through progressive cycles of reinforcement and cancellation.
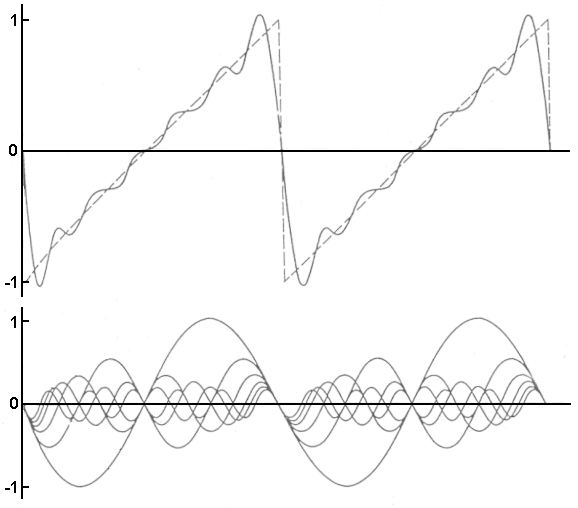
Figure 8: The addition of six tones of different frequencies and intensities resulting in the approximation of a "triangular" wave.
Figure 8 illustrates how very complex and unusual wave patterns can be created by adding together waves of different frequency, intensity and phase. In this case all of the waves start out "in phase", each higher frequency wave has a fixed ratio of frequency with the immediately lower frequency wave, and the lower frequency waves are lower in intensity than the higher frequency waves (in a fixed ratio). This pattern of original pure tones results in an approximation of a complex wave known as a "triangular" wave. An infinite series of such waves (each decreasing in frequency and intensity with fixed ratios) would result in an exact triangular wave as indicated by the dashed line.
In very complex examples, like the one in figure 8, an illustration showing the original waves as sine waves (ie. in a time domain representation) is not very helpful visually. This pattern is too complex to make much sense of visually. When we look at frequency domain representations (ie. "spectra") we will see that such complex patterns can be presented visually in a way that is much easier to interpret. The frequency analysis of complex sounds does the opposite of what we have been doing here, that is it extracts the original sine waves from a complex sound and presents them in a frequency domain visual representation (a spectrum).
Reference
Several of the diagrams above were adapted form the following book.
Ladefoged, P, 1962, Elements of Acoustic Phonetics, University of Chicago Press
Content owner: Department of Linguistics Last updated: 12 Mar 2024 9:57am