Nasality results
Oral-nasal airflow: results (2013)
Subjects
Oral-nasal airflow data and sound recordings were collected for 30 native speakers of Australian English over several years.
Please note: Owing to time constraints only a sub-set of the collected data is provided below and the data in table 1 only is supplemented with abstracted data based on the results of the real subjects. Please note that this data should not be quoted as real data and is only intended for use in the 2010 SPH308 oral-nasal airflow workshop. The fast reading of the rainbow passage has not been analysed. Additionally, time constraints did not permit the intended extraction and presentation of oral-nasal sound intensity data and so students are only required in 2010 to report on the oral-nasal airflow results.
Raw data
Oral and nasal airflow data and oral and nasal sound (SPL data) were collected. Figures 1- 7, below, illustrate the oral and nasal airflow and sound data for a single male speaker of Australian English. The associated sound files are for a different male speaker of Australian English.
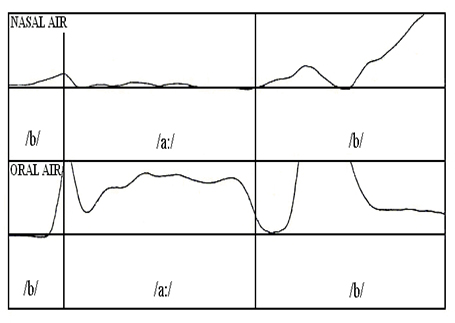
Figure 1: Contextual Nasality: "Chop /ba:b/". The vertical lines represent the phoneme boundaries.
If you look closely at figure 1 you will see that there is a great deal of oral airflow during the /a:/ vowel and a very much smaller amount of nasal airflow. Its likely that the very small fluctuations in nasal airflow are due to mask movement rather than actual nasal airflow. You should also note the large oral airflow peak at the boundary between the first /b/ and the vowel and also the large peak a short distance into the second /b/. These represent the large amount of oral airflow that occurs at the stop burst. Immediately before each burst is a period of zero oral airflow which represent the oral stop occlusions. The steep upward slope at the end of the final /b/ represents exhalation through the nose following speech.
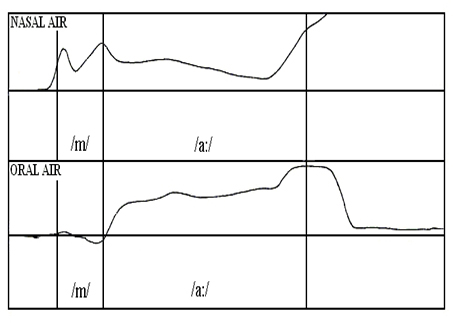
Figure 2: Contextual Nasality: "Chop /ma:/". The vertical lines represent the phoneme boundaries.
In this figure we can see significant nasal airflow during the /m/, indicating an open velum. At the same time there is effectively zero oral airflow because the oral tract is closed at the lips. Note that the nasal airflow during the /a:/ is quite significant (compare this with the nasal airflow during the /a:/ in /ba:b/ (figure 1, above). Further, the nasal airflow starts off high during this vowel as the velum is already open for the preceding /m/. The steep upward slope in nasal airflow at the end represents exhalation. The final oral airflow peak also represents exhalation which is abruptly terminated when the oral cavity is closed (in preparation for the next sound) and the remainder of the exhalation is then entirely nasal.
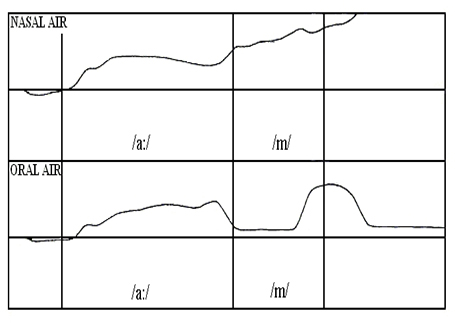
In this case the velum begins to open shortly after the start of the vowel and nasal airflow quickly rises (in parallel to the rise in oral airflow) and stays high for the vowel and the following /m/. As the /m/ is approached the lips begin to close and are effectively closed for the /m/ (the small amount of apparent airflow is an artefact of some sort and should be treated as effectively zero). Note that the lips open at the end of the /m/ but that shortly after the oral cavity closes in preparation for the next speech token.
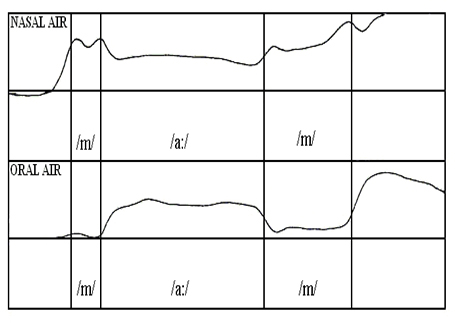
Figure 4: Contextual Nasality: "Chop /ma:m/". The vertical lines represent the phoneme boundaries.
Note the consistently high nasal airflow during the whole vowel. Also note the effectively zero oral airflow during the two /m/ phonemes. Note also that the nasal airflow during the vowel is lower than the nasal airflow during the two /m/ phonemes. This is because part of the total airflow is diverted through the oral cavity during the vowel.
Listen to an oral sound recording (from a similar male speaker) of the four utterances illustrated in figures 1 to 4.
And below you can listen to an equivalent nasal sound recording. You should particularly note the very weak nasal recording for the vowel in /ba:b/ compared to the much stronger nasal sound for the vowels in the other three contexts.
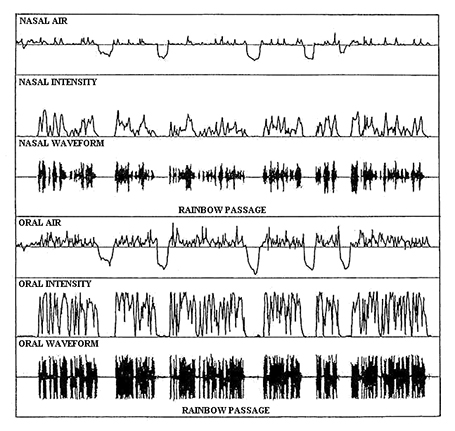
Figure 5: Pervasive Nasality: The "Rainbow" passage for a male speaker of Australian English is illustrated above.
Compare the file below for an equivalent oral sound recording.
And for an equivalent nasal recording listen to the file below.
The oral and nasal "intensity" tracks illustrated here are derived from running RMS (root-mean-squared) average sound pressure measurements of the recorded oral and nasal sound recordings. The deep negative dips in the oral and nasal airflow represent inhalation, in the case of figure 5, through both the nose and the mouth. If you listen closely to the supplied recordings you might note the greater intensity of some nasal consonants whilst listening to the nasal sound recording.
You should compare these recordings to the oral recording:
and the nasal recording:
of the "Naomi" passage. You may be able to hear a greater proportion of strong nasal consonants in the nasal recording of the Naomi passage (compared to the Rainbow passage).
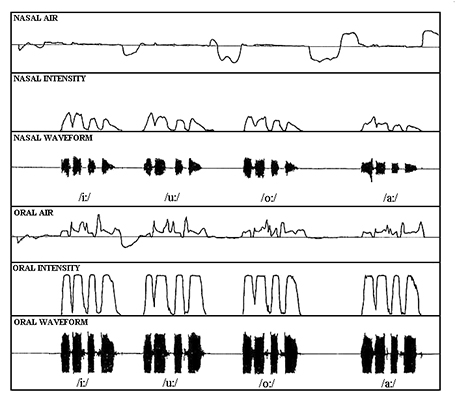
Figure 6: Intrinsic Vowel Nasality
Displayed here are the oral and nasal data for the four vowels /i:/, /u:/, /o:/ and /a:/ in the context /j_ b_z f_d tr_z/ (where "_" is the place-holder for each vowel. This results in the nonsense sentences "yee bees feed trees", "you booze food trues", "your bawz fawd traws", "yaa baaz faad traaz".
Listen below for an equivalent oral sound recording.
Listen below for an equivalent nasal sound recording.Any differences between the intrinsic nasality of the vowels in this recording is too subtle to be detected by listening to the oral and nasal sound tracks.
Processed data
Below is a set of tables incorporating measurements taken from 16 student participants and plus some additional abstracted data based on the measurements from actual subjects. The results consist only of nasal/oral airflow ratios. The ratios are expressed as the ratio of the nasal measure over the total (nasal plus oral).
(Nasal / (Nasal + Oral)) x 100%
As these values are ratios they have no units of measurement and are simply listed as percentages. These ratios were derived from airflow measurements (in litres/minute). Actually, these measurements were passed to the computer as voltages and we are only able to convert these to litres/minute because we have calibrated the system and know what voltages correspond to airflow values.
These ratios will be given for each of:- the passages, the four nonsense sentences, and the four nonsense words.
The duration (in minutes) of each of the passages (for each subject) have been measured. The rate of utterance (syllables/minute) can be derived from these durations by dividing the number of syllables in a passage by its duration. These values allow us to examine the hypothesis that rate of utterance has an effect upon "nasality".
|
Subject Number |
Subject Sex | Rainbow | Naomi | ||
| Rate | Air | Rate | Air | ||
| 1 | M | 228 | 19 | 230 | 29 |
| 2 | M | 229 | 26 | 240 | 31 |
| 3 | M | 229 | 30 | 250 | 36 |
| 4 | M | 224 | 23 | 260 | 30 |
| 5 | F | 289 | 41 | 290 | 47 |
| 6 | F | 253 | 41 | 300 | 49 |
| 7 | F | 232 | 32 | 260 | 37 |
| 8 | F | 261 | 45 | 310 | 46 |
| 9 | F | 221 | 26 | 230 | 31 |
| 10 | F | 234 | 38 | 250 | 41 |
| 11 | M | 234 | 22 | 253 | 30 |
| 12 | F | 242 | 25 | 253 | 31 |
| 13 | F | 288 | 30 | 322 | 40 |
| 14 | M | 234 | 25 | 295 | 34 |
| 15 | M | 234 | 23 | 253 | 27 |
| 16 | M | 203 | 32 | 236 | 36 |
| Mean | 240 | 30 | 264 | 36 | |
| Std.Dev. | 23 | 8 | 29 | 7 | |
| Number | 16 | 16 | 16 | 16 | |
Table 1: Comparison of the Rainbow passage (uttered at a normal rate only) and the Naomi passage as a function of their rates of articulation (syllables/minute) and nasal airflow (as a percentage of total airflow). A paired samples t-test indicates that rates of utterance differ significantly for the Rainbow and Naomi passages (p<0.001). A paired samples t-test indicates that nasal airflow differs significantly (p<0.001) for the Rainbow Naomi passages. There are also significant correlations between the rate of utterance and nasal airflow for the rainbow passage (p<0.05) and for the Naomi passage (p<0.01). Click here to see graphs illustrating these correlations. Warning: Please note that some of the data in this table (indicated by bold red characters) is not real data and this data should only be used for the purposes of the oral-nasal airflow workshop.
|
Sbj # | Sex | Vowel Intrinsic | Vowel Contextual | ||||||
| i: | u: | o: | a: | ba:b | ma: | a:m | ma:m | ||
| 1 | M | 8 | 12 | 7 | 11 | 8 | 30 | 28 | 27 |
| 2 | M | 13 | 7 | 7 | 10 | 14 | 35 | 41 | 42 |
| 3 | M | 15 | 9 | 7 | 13 | 16 | 47 | 47 | 45 |
| 4 | M | 6 | 7 | 5 | 16 | 8 | 38 | 38 | 37 |
| 5 | F | 29 | 16 | 13 | 19 | 39 | 67 | 61 | 65 |
| 6 | F | 37 | 26 | 19 | 36 | 39 | 48 | 53 | 48 |
| 7 | F | 11 | 6 | 8 | 16 | 4 | 45 | 33 | 40 |
| 8 | F | 43 | 34 | 34 | 44 | 40 | 50 | 53 | 51 |
| 9 | F | 21 | 9 | 8 | 11 | 14 | 26 | 25 | 35 |
| 10 | F | 35 | 28 | 26 | 30 | 27 | 19 | 44 | 32 |
| 11 | M | 7 | 8 | 7 | 8 | 8 | 27 | 48 | 48 |
| 12 | F | 12 | 9 | 9 | 12 | 20 | 49 | 35 | 42 |
| 13 | F | 7 | 7 | 7 | 8 | 10 | 49 | 13 | 32 |
| 14 | M | 11 | 9 | 10 | 10 | 18 | 54 | 49 | 50 |
| 15 | M | 17 | 16 | 15 | 12 | 22 | 40 | 18 | 45 |
| 16 | M | 23 | 13 | 14 | 19 | 27 | 50 | 32 | 45 |
| Mean | 18 | 14 | 12 | 17 | 20 | 42 | 39 | 43 | |
| Std.Dev. | 12 | 9 | 8 | 11 | 12 | 13 | 13 | 9 | |
| Number | 16 | 16 | 16 | 16 | 16 | 16 | 16 | 16 | |
Table 2: The four "Vowel Intrinsic" nasality columns compare the nasal airflow (as a percentage of total airflow) across an entire utterance of the type "yee beez feed trees", for each subject and for each vowel in this context. The four "Vowel Contextual" nasality columns compare the nasal airflow (as a percentage of total airflow) across only the /a:/ in each "chop /a:/" context for each subject. The nasal airflow for the /a:/ vowel in /ba:b/ is significantly different (p < 0.01) from the /a:/ vowel in the three nasal contexts. Comparisions of any pair of vowels for the "Vowel Intrinsic" nasal airflow data show no significant differences.
| Airflow |
High Vowels /i:, u:, o:/ |
Low Vowels /a:/ |
High-back /u:, o:/ |
Non-high-back /i:, a:/ |
| Mean | 15 | 17 | 13 | 18 |
| Std.Dev. | 9 | 11 | 8 | 11 |
| Number | 48 | 16 | 32 | 32 |
Table 3: Intrinsic nasal airflow statistics for two pairs of vowel classes:- High /i:, u:, o:/ versus Low /a:/ and High-Back /u:, o:/ versus non-High-Back /i:, a:/. The second pair of vowel classes is motivated by the assumption that the high-back vowels are articulated approximately adjacent to the velum and so they might form a natural class with respect to intrinsic vowel nasality. There is no significant difference between the "High" and "Low" vowels. There is a significant difference (p < 0.05) between the "High-back" and the "Non-high-back" vowels, but only if the individual vowel utterances are treated as independent (View further discussion on this).
| Articulation Rate | Nasal Airflow | |
| MALE DATA | ||
| Mean | 227 | 25 |
| Std.Dev. | 10 | 4 |
| Number | 8 | 8 |
| FEMALE DATA | ||
| Mean | 253 | 35 |
| Std.Dev | 25 | 8 |
| Number | 8 | 8 |
Table 4: Comparison of male and female articulation rate and nasal airflow for the Rainbow Passage utterances. The rate of utterance is significantly different for males an females (p < 0.05). Nasal airflow is significantly different for males and females (p < 0.01).
Interpreting statistical data in tables one to four
Some prior study of statistics is assumed knowledge for this unit and the vast majority of students taking this unit will have completed both STAT170 and PSY222. A small number of students come into this unit without the necessary statistical background. Some advice on how to interpret the statistics provided above can be found on the statistics page.
Analysis of results
View more information on the analysis of these results.
Content owner: Department of Linguistics Last updated: 12 Mar 2024 9:46am