This article was originally published by Nick Parr on The Conversation, and shared as part of the Creative Commons.
Higher education is a major determinant of a population’s knowledge and skills, workforce participation, employment, incomes, economic growth, immigration, family formation, and of the educational attainment and future prosperity of subsequent generations.
The percentage of Australia’s population with a Bachelor’s degree is high by international standards. But who goes to university? And how are the patterns changing?
Growth
In 2013 just over 1.3 million students were enrolled in higher education in Australia. In recent years the number of students has increased as a share of the population, with 2011 census data showing 36.6% of 20-year-olds attending university or other tertiary institutions (up from 32.6% in 2006).
In 2011 the percentage of the population aged 15 and above with a Bachelor’s degree or higher (18.8%) was over nine times the figure for 1971 (2%).
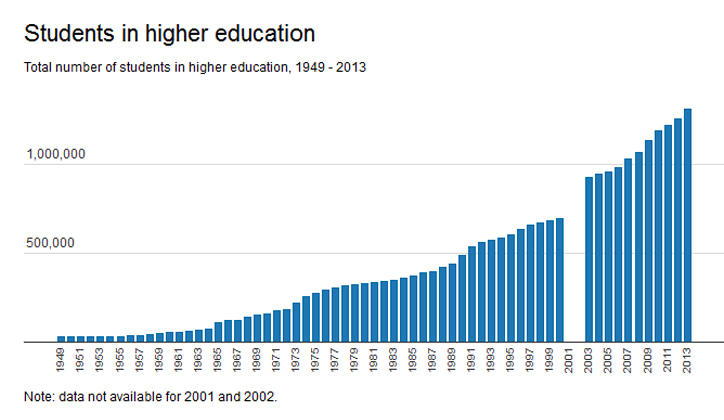
Source: Department of Education and Training Get the data
Overseas students account for a high proportion of students by international standards. The rate of growth in the number of international students was especially rapid between 2000 and 2009, and far exceeded that for domestic students. While over the 2010-12 period the number of international students fell (by 3.5%), the increase in domestic students more than offset this numerically.
The percentage of international students peaked at 28.3% in 2009 before falling to 25.0% in 2013. In the first half of 2014 the number of international students in Australia reached a record level.
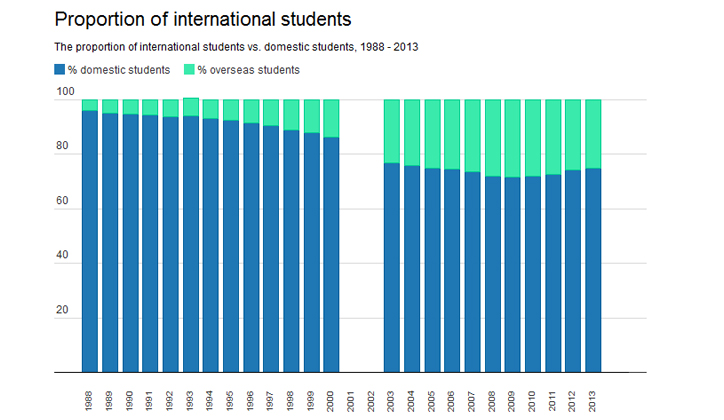
Source: Department of Education and Training Get the data
Substantial numbers of former international students transition to permanent residency in Australia. After a reduction between 2007 and 2010, following immigration policy reform, the number of former students gaining permanent residency has recovered. This is due to increased numbers transitioning from new temporary visas.
Management and commerce remains the leading broad field of education. However, since 2009 the growth of students in this field has stalled and the growth rate has been well below those for society and culture and health.
Gender imbalance
Female students have outnumbered their male counterparts since 1987, and now do so by a considerable margin. In 2014 the sex ratio for higher education students was just 80 males per 100 females.
This compares, for example, to 269 males per 100 females in 1970. The numerical imbalance between male and female students widened between 2004 and 2012 (from 84.1 to 79.3 males per 100 females), but has closed slightly over the last two years.
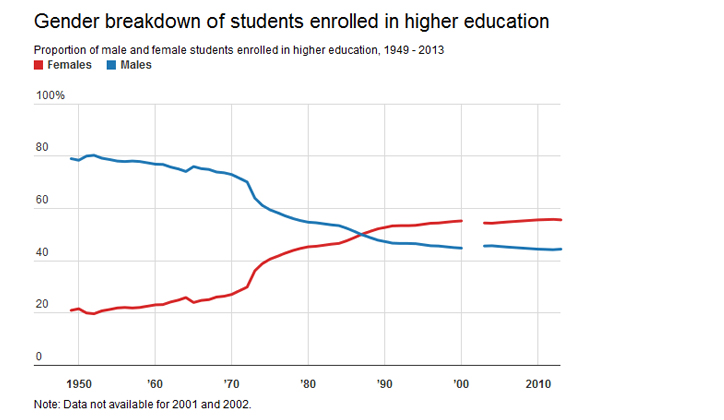
Source: Department of Education and Training Get the data
The distributions of male and female students between subject areas remain asymmetrical. Females are severely underrepresented among students of IT, engineering and related technologies, and architecture and building. Males are underrepresented among education, health, society and culture, and creative arts students.
The study fields with the higher proportions of females tend to have lower lifetime income expectations. The gendered differences in study patterns are likely to promote continuing sex segregation in some professional occupations in the future.
The underrepresentation of the disadvantaged
Family background remains an important determinant of who studies at university.
Despite a modest increase over the last ten years, people from lower socioeconomic status areas remain underrepresented among higher education students. Only 16.1% of domestic higher education students having a permanent home address in the 25% lowest socioeconomic postcodes.
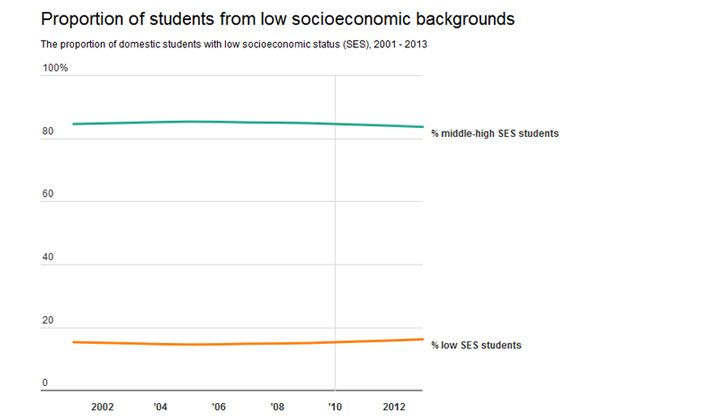
Note: Socioeconomic status based on 2006 SEIFA Education and Occupation Index for postal areas, where postal areas in the bottom 25% of the population aged 15-64 being classified as low SES.
Source: Department of Education and Training Get the data
The increase in the percentage of students from low socioeconomic areas has accelerated gradually over the phased implementation of demand-driven funding since 2010.
Source: Department of Education and Training Get the data
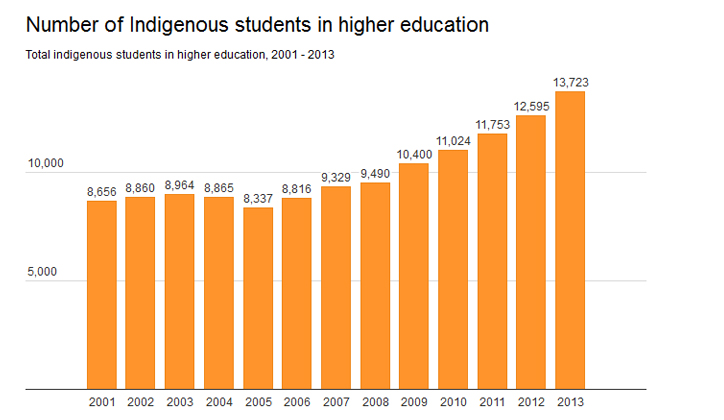
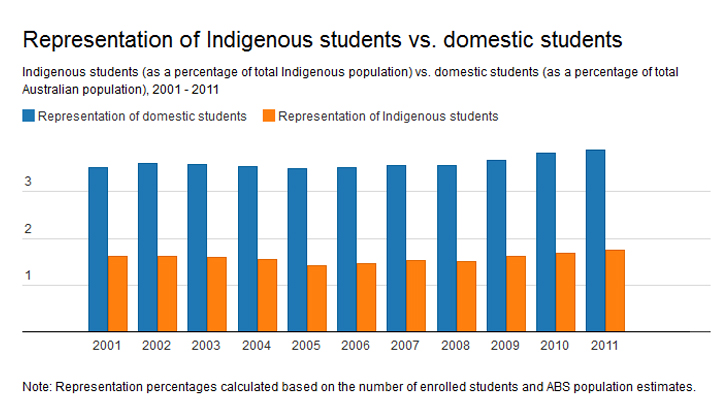
The Indigenous population is also underrepresented (just 1.4% of domestic students in 2014). There has been a partial “closing of the gap” in higher education participation in recent years. The percentage of Indigenous students has increased gradually from 1.2% in 2005, and slightly more rapidly than could be explained by the growth of the percentage of Indigenous people in the relevant population age groups.
Source: Derived from Department of Education and ABS data Get the data
Linguistic and religious diversity
Australia’s university student population is more diverse than the wider population in terms of languages spoken at home. According to 2011 census data, 31.2% of students speak a language other than English at home. Mandarin (6.8%), Cantonese (3.1), Arabic (2.0) and Vietnamese (1.8) are the most commonly spoken languages other than English among students.
Students’ patterns of religious adherence also are significantly more diverse than those of the wider community. Only 50.7% of students are Christians (compared to 66.9% for Australia), while the percentages with no religion (34.0% compared to 24.4% nationally), Buddhist (5.0% compared to 2.7%), Muslim (4.2% compared to 2.4%) and Hindu (2.6% compared to 1.4%) all are significantly above average.
The percentage with no religion is almost as high among Australia-born students as among overseas-born students, and is higher among students than among people of the same age who are not studying.
Work and study combination
By international standards the percentage of Australia’s students who combine study with work is high. In the 2011 census, 62.4% of tertiary students were in work, with nearly twice as many working part-time as working full-time.
The percentage of students who also work fell slightly (from 65.6%) between 2006 and 2011. This may be related to an ongoing increase in the percentage who study full-time (66.9% in 2006 to 73.7% in 2011).
The top four occupations while studying are in sales or hospitality: sales assistants (7.7% of students), waiters (2.9), checkout operators and office cashiers (2.1), and bar attendants and baristas (1.8). The short-term opportunity cost of study would be reduced by the high percentage of students who also work.
The future
Australia’s universities should be planning to accommodate further growth in numbers of domestic student enrolments, in view of the projected 25% growth of the 18-24 years old population over the next 20 years.
The projected growth is due to recent increases in births and high levels of immigration.
The larger cohorts of prospective local graduates may reduce Australia’s need for skilled immigrants, to the detriment of some future international students.
Failing to expand future domestic student enrolment at least in line with demographic growth may have a negative effect on equality in higher education. It would be a shame to see young people from lower socio-economic or other disadvantaged backgrounds miss out on going to university because our higher education system has failed to prepare for our growing population.
Catch up on recent contributions to The Conversation from other Macquarie authors.