iTRAQ results Page
Prerequisites
Organism and search database
Clarify organism/database to be used for searching with Protein Pilot, such as Swiss Prot, Ensembl, species specific, etc; the protein identifications will arise from this database.
Experiment design
Identify the experimental groups, replicates and their placement in iTRAQ runs (4-plex). A simple example is shown below using 4-plex runs.
Run\Label | 114 | 115 | 116 | 117 |
Run 1 | Sample A1 | Sample A2 | Sample B1 | Sample B2 |
Run 2 | Sample A1 | Sample B1 | … | … |
Run 3 | … | … | … | … |
Comparisons of interest
Example: in the simple design above, the comparisons of interest could be proteins changing in abundance between samples A and B, or between replicates A1 and A2, etc. There could be technical or biological repeats depending on project.
Typical outputs of an iTRAQ standard analysis
Protein Identification Files
The main output of an iTRAQ analysis Protein identification lists resulting from Protein Pilot searches; they are called Protein Summary files, and contain identifications and quantitative data for each run. The iTRAQ quantitation is not absolute, but determined with respect to a reference. For instance, in the example above, protein abundance ratios will be generated for each run, with respect to Sample A1, Sample A2, etc.
Differentially expressed proteins
Within an iTRAQ run, differentially expressed proteins can be determined based on the ratios and p-values provided by Protein Pilot; the p-values are generated by Protein Pilot using the peptides used to quantitate the respective protein, and give a measure of confidence that the ratio is different from 1. Proteins are considered differentially expressed if the Protein Pilot ratios are either > 1.2 or < 0.83 and Protein Pilot p-values are < 0.05.
If differentially expressed protein highlighting is requested, a spread sheet will be provided with ratios > 1.2 are marked in red, ratios < 0.83 are marked in green, and p-values < 0.05 in yellow. A tabbed spread sheet will be generated, with a tab for each comparison of interest requested. Gene ontology information such as protein Biological Process, Molecular Function and Cellular component can be appended if available.
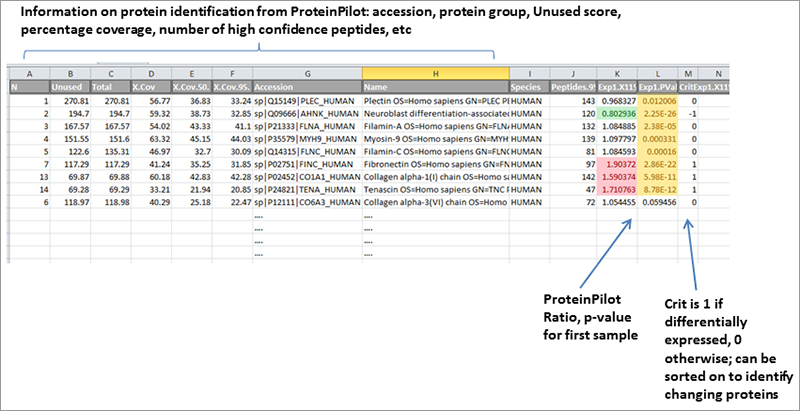
Sample spread sheet with protein identifications highlighted
Differentially expressed proteins combining
If requested, protein ratios from the same group can be combined, for example in order to consolidate similar information across different iTRAQ runs. For example, in the design example above, if repeated runs were available then the values of Sample B1 / Sample A1 could be consolidated from across runs to check for across runs consistency.

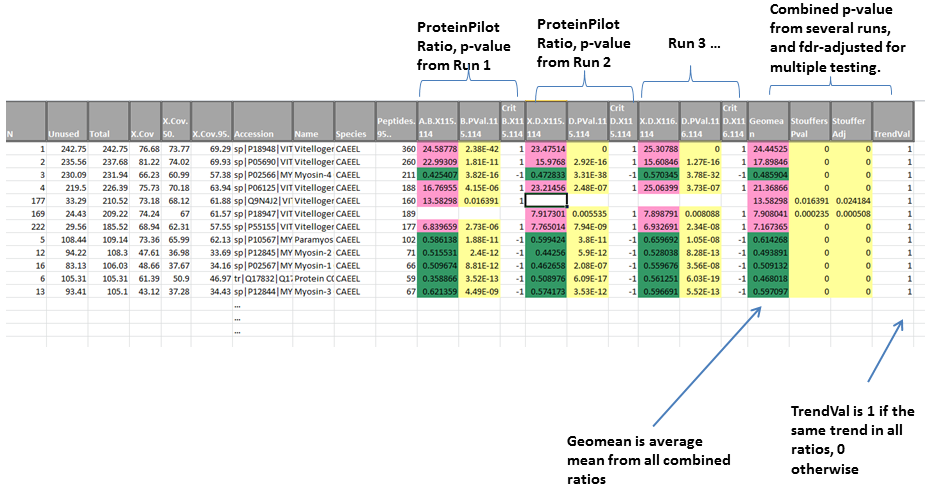
Example of combining ratios across runs
If values are combined, then an average value is generated (geometric mean of all combined ratios), and a combined p-value calculated using Stouffer’s method. The sample output is shown in Figure 2. Gene ontology information such as protein Biological Process, Molecular Function and Cellular component can be appended if available.
Custom analyses
Additional analyses are possible but have to be discussed for each individual project, due to the complexity of iTRAQ designs and the multitude of analysis avenues.