Vowel spectra
In this topic you will be presented with a number of spectrograms and FFT/LPC spectra of vowels (in a /h_d/ frame) spoken by an adult male speaker of Australian English. The spectrograms each display the whole vowel preceded and followed by a small fragment of each of the surrounding consonants. The spectrograms are all bandlimited to the frequency range 0-5000 Hz. At least one cross-sectional spectrum is also displayed for each vowel. These spectra display both an FFT and an LPC analysis of the vowel spectrum bandlimited to the range 0-5000 Hz. The location of the analysis window for each spectrum is indicated on the waveform at the bottom of each spectrum with the vertical red line indicating the centre of the analysis window and the two light blue lines indicating the start and end of the analysis window.
In the spectrograms (and in the waveform and transcription boxes below both the spectrogram and the FFT/LPC windows, phoneme boundaries are indicated by the unbroken vertical purple lines and the approximate start and end of the vowel target (or targets in the case of diphthongs) is indicated by the dashed vertical purple lines.
To simplify font display issues, each vowel will either be identified by the orthographic form of the /h_d/ word from which it is taken or the ANDOSL symbols will be used in the text. The actual phoneme symbols are displayed on each graphic in the transcription window below the waveform. (You should note that as Australian English is a non-rhotic dialect, so post-vocalic "r" is not pronounced in the /h_d/ words that are spelt with an "r".)
We expect to see clear formants for front vowels and for central, mid and high vowels and less clear formant patterns for low (non-front) vowels and for back vowels. Also look for formant patterns in the preceding /h/ and formant transition movements toward the following /d/ occlusion.
A pdf version of this topic is available.
1) "heed"
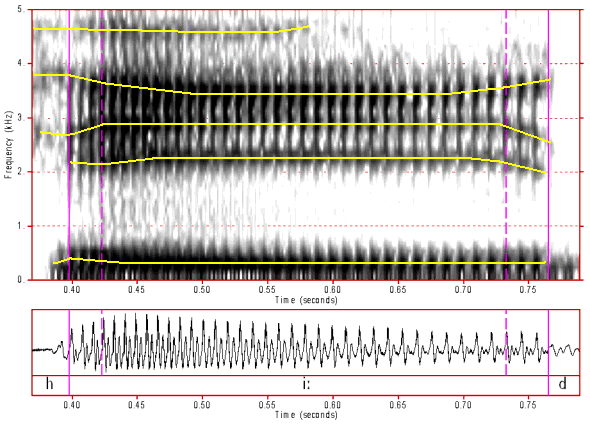
Figure 1: Broadband spectrogram of the vowel /i:/ from the token "heed". Formants are indicated by the yellow lines. Click anywhere on the image to hear the sound.
The location of F1 is fairly clear on this spectrogram but as with many vowels with low frequency formants its difficult to visually separate the F1 band from the baseline. F2, F3 and F4 are clustered together between 2000 and 4000 Hz, but with the current topclip and depth settings the bands are reasonably clearly separated. When F2 is close to F3 this has the effect of strengthening F3 and F4 and making them stronger and more clearly visible. Only part of the vowel F5 is visible. F3, F4 and F5 are visible in the preceding /h/. F2, F3 and F4 have clear transitions into the following /d/ occlusion.
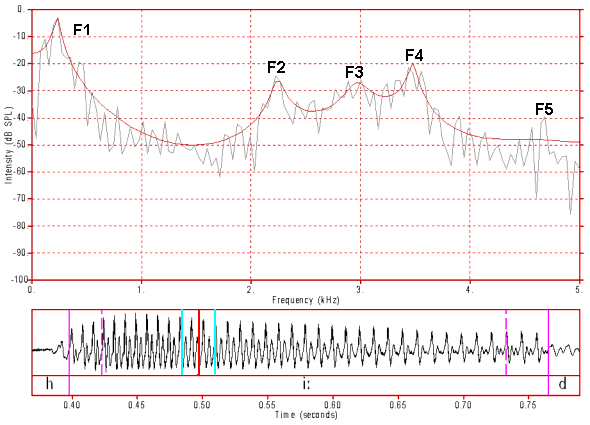
Figure 2: An FFT and LPC spectrum of the vowel /i:/. The window is about 23 ms in length and the location of the window is shown by the vertical red and light blue lines. The LPC is calculated using 12 poles. Click anywhere on the image to hear the sound.
In this spectrum formants F1 to F4 are clear on both the FFT and the LPC plots. F5 is reasonably clear on the FFT plot, but more LPC poles would be required for the F5 peak to be shown on this curve.
2) "hid"
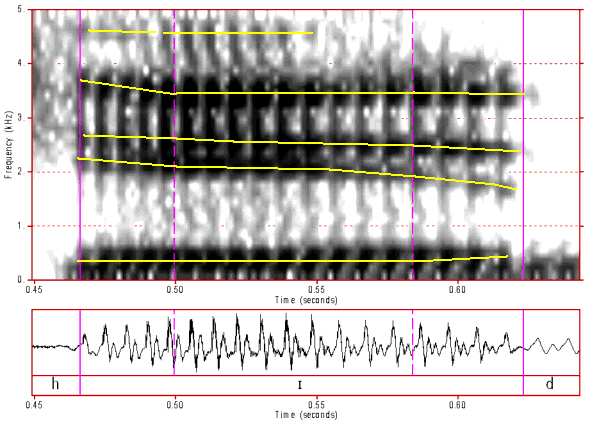
Figure 3: Broadband spectrogram of the vowel /I/ from the token "hid". Formants are indicated by the yellow lines. Click anywhere on the image to hear the sound.
The spectrogram of the vowel /I/ is very similar to that of the vowel /i:/ except that the formants are not very clear in the preceding /h/. As we can see here and in the next diagram, F1 is a bit higher and F2 is a bit lower than for /i:/, above.
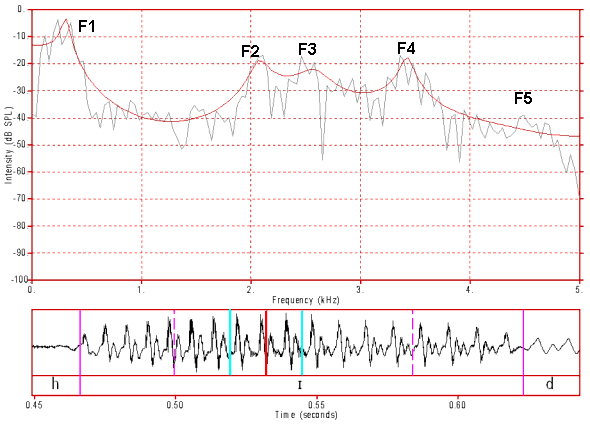
Figure 4: An FFT and LPC spectrum of the vowel /I/. The window is about 23 ms in length and the location of the window is shown by the vertical red and light blue lines. The LPC is calculated using 12 poles. Click anywhere on the image to hear the sound.
In this spectrum all formants are reasonably clear except for F5. The spectrum appears to be affected by some zeroes (spectral holes) just above the F1 peak and possibly between F3 and F4. Its often unclear whether zeroes are actually present as the window size and sampling rate sometimes interact with the pattern of harmonics to give the appearance of spectral holes.
3) "had"
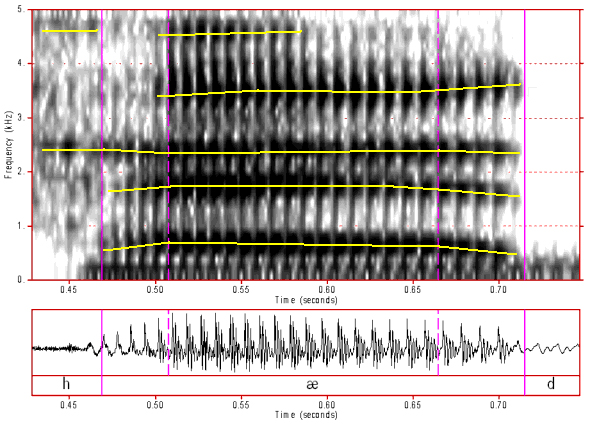
Figure 5: Broadband spectrogram of the vowel /A/ from the token "had". Formants are indicated by the yellow lines. Click anywhere on the image to hear the sound.
In this spectrogram of the vowel /A/formant F1 to F4 are all clear in the target and the final transition but F4 is not so clear in the initial transition. Only part of F5 can be seen. Only F3 and F5 seem visible in the preceding /h/ (although arguably parts of F3 and F4 can also be seen).
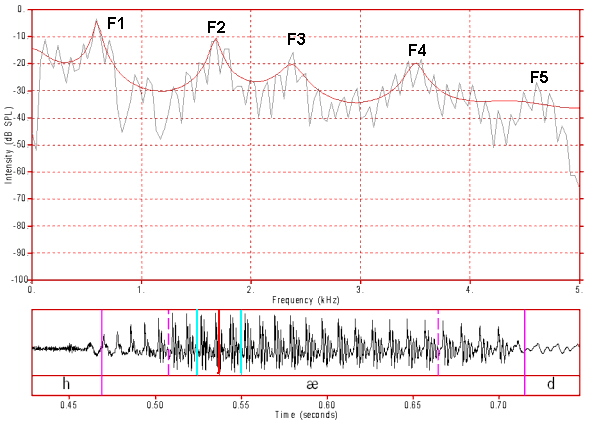
Figure 6: An FFT and LPC spectrum of the vowel /A/. The window is about 23 ms in length and the location of the window is shown by the vertical red and light blue lines. The LPC is calculated using 12 poles. Click anywhere on the image to hear the sound.
In this spectrum all 5 formants are clear in the FFT spectrum but the LPC would require more than 12 poles to pick out the F5 peak. Note the slight low frequency peak in the FFT at the first two harmonics. This might be due to some degree of velum opening and therefore to some nasal resonance. On the other hand this low frequency peak might simply be a consequence of the slope of the source spectrum (which favours low frequencies). The two major dips between F1 and F2 are very likely the result of antiresonances (ie. spectral zeroes).
4) "hard"
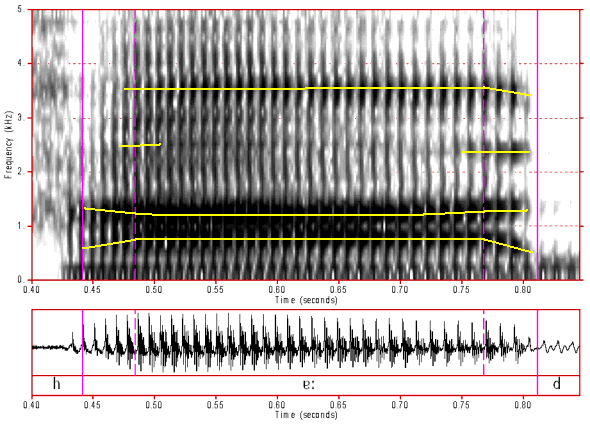
Figure 7: Broadband spectrogram of the vowel /a:/ from the token "hard". Formants are indicated by the yellow lines. Click anywhere on the image to hear the sound.
In this spectrogram F1 is high and is very close to F2. The two formants are rather difficult to resolve in places. F3 can only be seen clearly in the final transition and also possibly near the start of the target. F4 is reasonably clear over the target and final transition. F5 cannot be discerned. This kind of pattern is quite common for low and back vowels. For such vowels, the higher formants are not very clear and are generally regarded to be not very important perceptually.
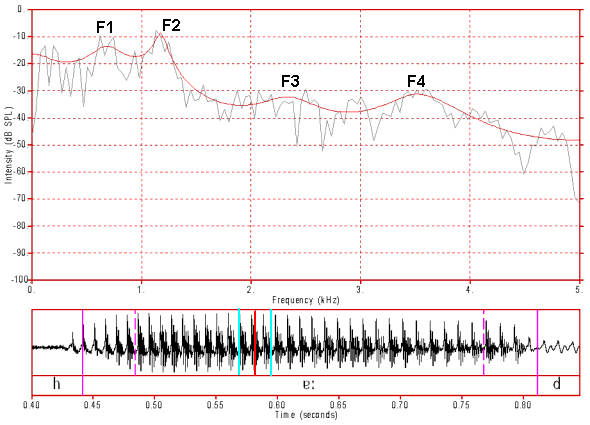
Figure 8: An FFT and LPC spectrum of the vowel /a:/. The window is about 23 ms in length and the location of the window is shown by the vertical red and light blue lines. The LPC is calculated using 12 poles. Click anywhere on the image to hear the sound.
In this spectrum F1 and F2 are quite clear. A small peak can be seen at the first two harmonics. F3 and F4 are not very clear although F4 is a bit more prominent than F3. F5 is not visible.
5) "hud"
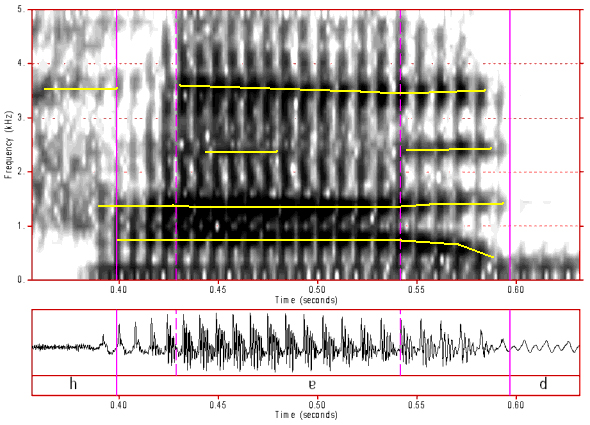
Figure 9: Broadband spectrogram of the vowel /V/ from the token "hud". Formants are indicated by the yellow lines. Click anywhere on the image to hear the sound.
The spectrogram for /V/ is very similar to (but shorter than) that of /a:/ (as we would expect given that the main difference between these two vowels in Australian English is duration). As with /a:/, F3 is only partially visible and F5 is not visible.
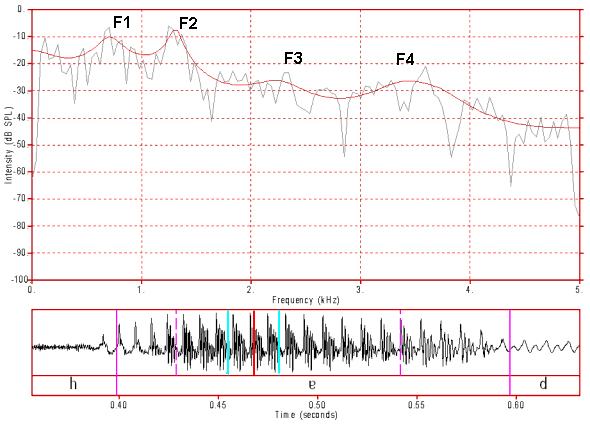
Figure 10: An FFT and LPC spectrum of the vowel /V/. The window is about 23 ms in length and the location of the window is shown by the vertical red and light blue lines. The LPC is calculated using 12 poles. Click anywhere on the image to hear the sound.
F1 and F2 are quite clear on both the FFT and the LPC spectra. F3 is very indistinct. F4 seems to be fairly clear but this might be facilitated visually by a likely spectral zero at about 3800 Hz giving the appearance of an upper boundary of a possible F4 peak.
6) "hod"
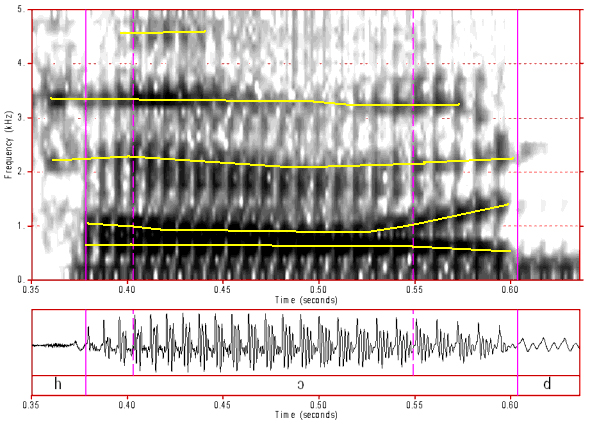
Figure 11: Broadband spectrogram of the vowel /O/ from the token "hod". Formants are indicated by the yellow lines. Click anywhere on the image to hear the sound.
Over most of the vowel target, F1 and F2 are not clearly separate. They are only clearly separate in the transition into the following /d/ occlusion. The exact location of F3 is not very clear as the formant band is quite wide. F4 is mostly clear, even in the preceding /h/, although it is a bit indistinct in the middle of the target. F5 is only clear at the start of the target.
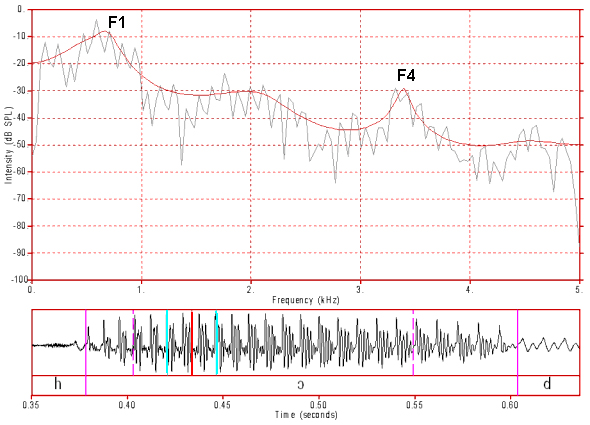
Figure 12: An FFT and LPC spectrum of the vowel /O/. The window is about 23 ms in length and the location of the window is shown by the vertical red and light blue lines. The LPC is calculated using 12 poles. Click anywhere on the image to hear the sound.
Neither the FFT or the LPC spectrum manage to separate F2 from F1. F2 is most likely between 800 and 1100 Hz, but there appears to be a spectral zero at about 1000-1200 Hz which may be obscuring F2. The only other clear formant is F4. F3 is a broad band with no clear peak. There might be a spectral zero between F3 and F4 at about 2600 to 2800 Hz.
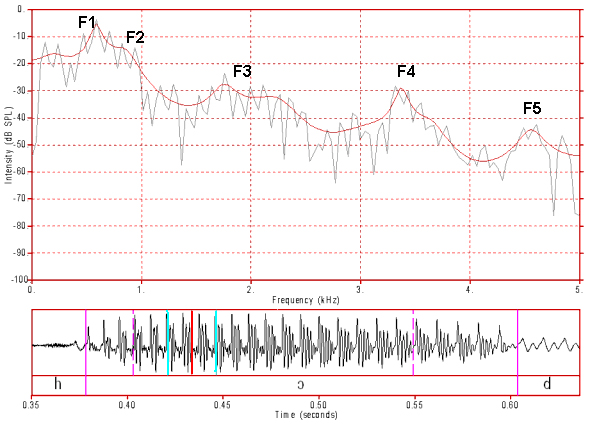
Figure 13: An FFT and LPC spectrum of the vowel /O/. The window is about 23 ms in length and the location of the window is shown by the vertical red and light blue lines. The LPC is calculated using 24 poles. Click anywhere on the image to hear the sound.
When we increase the number of poles in the LPC analysis a "shoulder" appears on the curve above F1. This can be assumed to be approximately the location of F2. Note that with the extra poles, F5 also becomes visible in the LPC spectrum.
7) "hoard"/"horde"
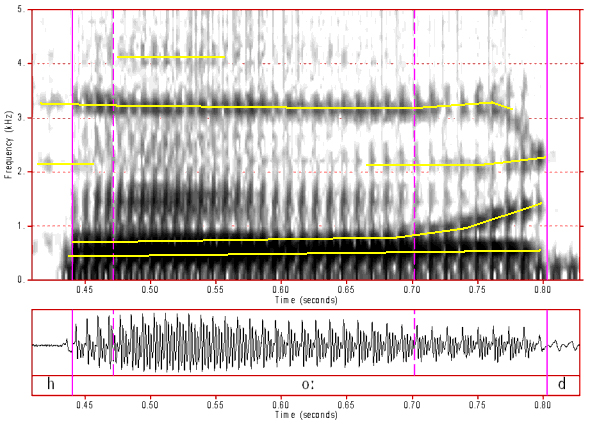
Figure 14: Broadband spectrogram of the vowel /o:/ from the token "hoard". Formants are indicated by the yellow lines. Click anywhere on the image to hear the sound.
As with /O/, in the spectrogram of /o:/ F1 and F2 appear to have merged and its not possible to separate them visually. In such cases the convention is to draw F1 near the bottom of the fused formant band and F2 near the top of the band. F3 is mostly indistinct except around the transitions. F4 is clear from the /h/ to the transition into the following /d/ occlusion. F5 is barely distinct only near the start of the vowel target. A band of energy appears between 1000 and 2000 Hz in the early part of the vowel target. This is most likely not a formant as its too low for F3 (see the comments about figure 16, below).
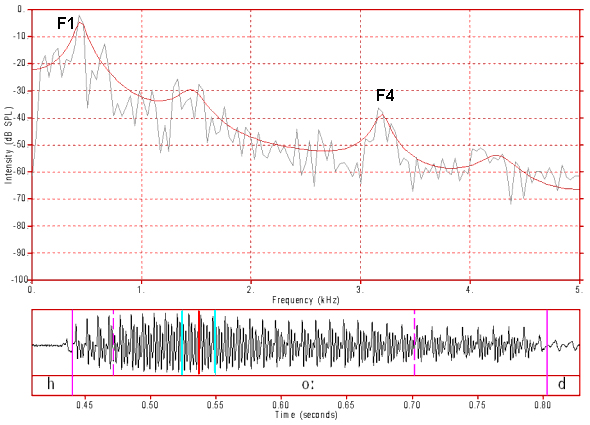
Figure 15: An FFT and LPC spectrum of the vowel /o:/. The window is about 23 ms in length and the location of the window is shown by the vertical red and light blue lines. The LPC is calculated using 12 poles. Click anywhere on the image to hear the sound.
Only F1 and F4 are clear in this spectrum, particularly in the LPC spectrum. Its desirable to examine an LPC spectrum that utilises more poles (see figure 16, below).
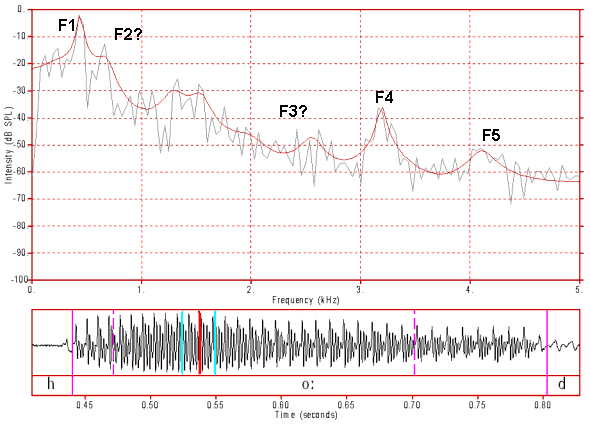
Figure 16: An FFT and LPC spectrum of the vowel /o:/. The window is about 23 ms in length and the location of the window is shown by the vertical red and light blue lines. The LPC is calculated using 24 poles. Click anywhere on the image to hear the sound.
In figure 16, the LPC analysis utilises 24 poles and so it indicates more peaks. This extra detail comes with a cost, however, as it provides detail that's not related to formant structure and is not perceptually salient. For an adult male speaker of Australian English we would expect an /o:/ F2 between about 800 and 1100 Hz. This doesn't seem to be the case here, and this is most likely due to the presence of spectral zeroes between 800 Hz and 1250 Hz in this spectrum. The presence of these zeroes has obscured (cancelled out) F2 and has also had the effect of making the region between 1250 Hz and 1600 Hz seem to be a prominent peak. F3 would be expected to be somewhere between 2000 Hz and 2500 Hz. Its absence might also be because it has been cancelled out by a spectral zero.
8) "hood"
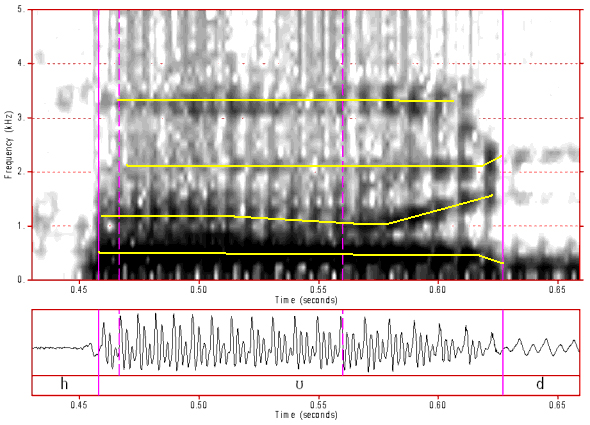
Figure 17: Broadband spectrogram of the vowel /U/ from the token "hood". Formants are indicated by the yellow lines. Click anywhere on the image to hear the sound.
In this spectrogram, F1 is quite clear throughout the vowel. F2 seems to be clear, but see the notes accompanying figure 18. F3 is weakly evident throughout the vowel whilst F4 is quite clear. There is no trace of F5 on this spectrogram. Formants are not clearly seen in the /h/, with the possible exception of F4 just before the start of the vowel. We can see evidence of F2 and F3 going into the stop occlusion (and examination of a full spectrogram shows that they persist until about half way through the occlusion). Perhaps the tongue contact with the alveolar ridge is not complete during the first part of this stop occlusion, allowing some high frequency energy to escape from the posterior cavity (remember that only very low frequencies tend to escape through the vocal tract walls during a full occlusion).
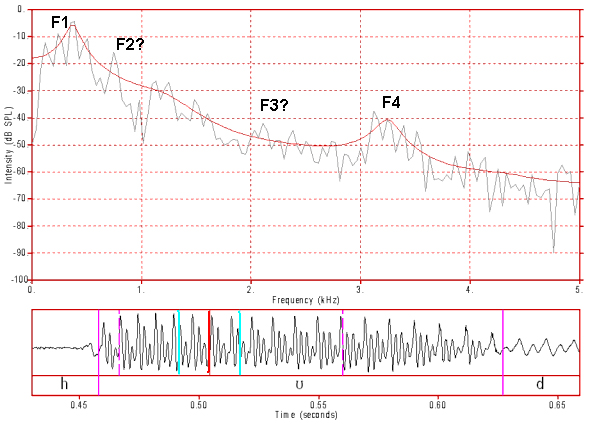
Figure 18: An FFT and LPC spectrum of the vowel /U/. The window is about 23 ms in length and the location of the window is shown by the vertical red and light blue lines. The LPC is calculated using 12 poles. Click anywhere on the image to hear the sound.
F1 and F4 are quite clear in this spectrum. F3 is arguably non-existent at this point in the vowel. What's particularly interesting here is F2. There are possible candidate peaks either side of 1000 Hz. The dip between them is almost certainly a spectral zero. We expect, from data collected from adult male speakers of Australian English, that F2 would be between 800 Hz and 1100 Hz. That would most likely place the formant at the same frequency as the antiresonance. As a consequence the centre of the F2 peak is cancelled out leaving small artifact peaks either side of the zero.
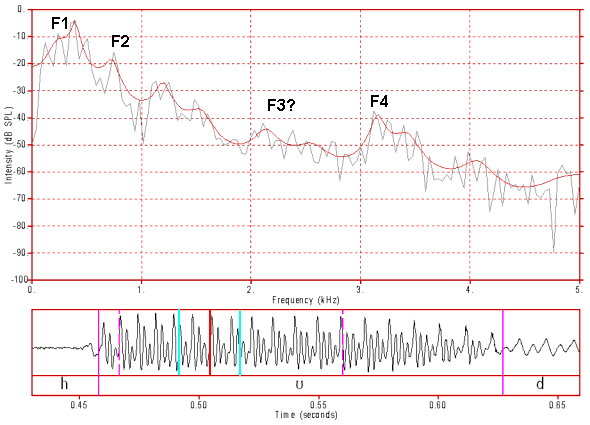
Increasing the number of poles in the LPC analysis of this spectrum does not reveal any additional information. The LPC analysis now picks up the two peaks either side of 1000 Hz but this does not help us decide which, if either, of these peaks is F2.
Figure 19: An FFT and LPC spectrum of the vowel /U/. The window is about 23 ms in length and the location of the window is shown by the vertical red and light blue lines. The LPC is calculated using 24 poles. Click anywhere on the image to hear the sound.
.
9) "who'd"/"hude"
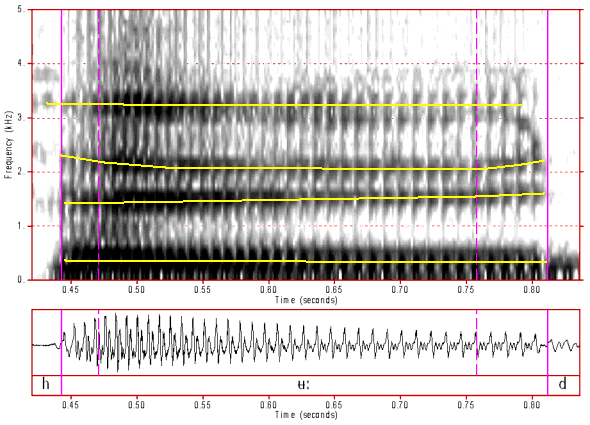
Formants F1, F2, F3 and F4 are very clear in this spectrogram and F2-F4 can also be seen in the /h/.
Figure 20: Broadband spectrogram of the vowel /u:/ from the token "who'd". Formants are indicated by the yellow lines. Click anywhere on the image to hear the sound.
As with the spectrogram, the first four formants are also very clear in this FFT and 12 pole LPC analysis.
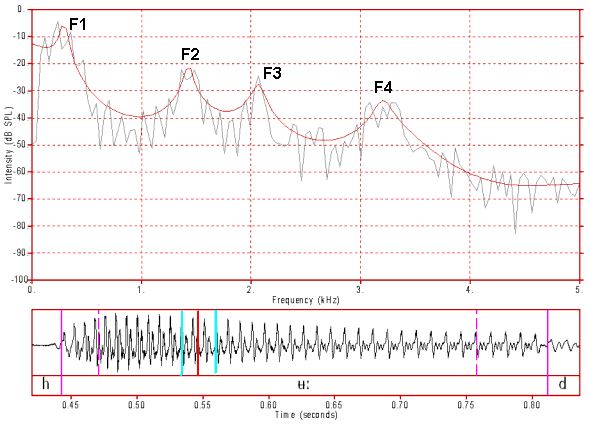
Figure 21: An FFT and LPC spectrum of the vowel /u:/. The window is about 23 ms in length and the location of the window is shown by the vertical red and light blue lines. The LPC is calculated using 12 poles. Click anywhere on the image to hear the sound.
10) "heard"/"herd"
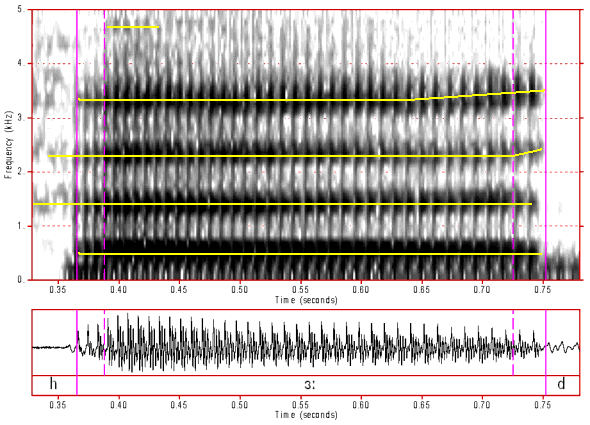
As with /u:/, formants F1, F2, F3 and F4 are very clear in this spectrogram and F2-F4 can also be seen in the /h/.
Figure 22: Broadband spectrogram of the vowel /@:/ from the token "heard". Formants are indicated by the yellow lines. Click anywhere on the image to hear the sound.
As with the spectrogram, the first four formants are also very clear in this FFT and 12 pole LPC analysis. There appears to be a spectral zero between 4200 and 4600 Hz, which most likely coincides with F5.
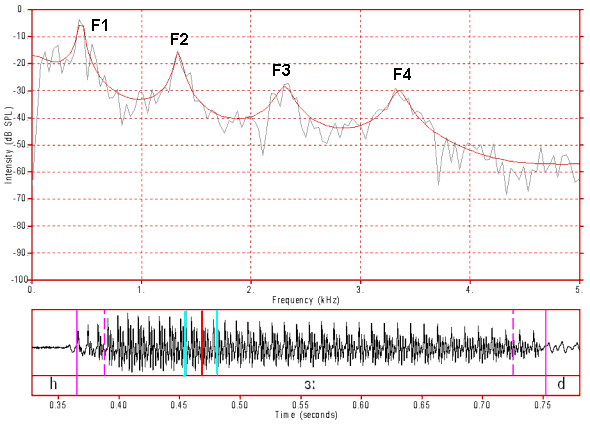
Figure 23: An FFT and LPC spectrum of the vowel /@:/. The window is about 23 ms in length and the location of the window is shown by the vertical red and light blue lines. The LPC is calculated using 12 poles. Click anywhere on the image to hear the sound.
11) "hide"
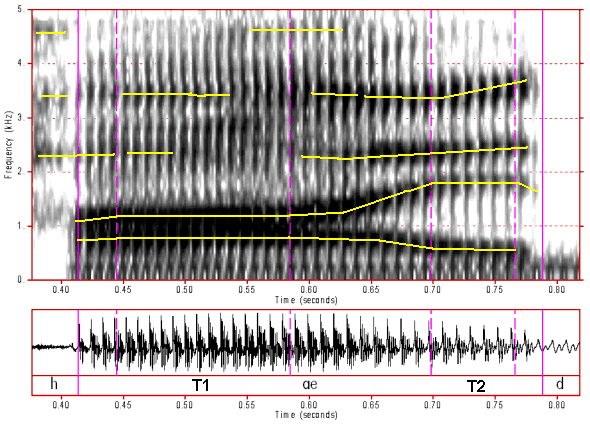
In this spectrogram we can see two targets, target 1 (T1) and target 2 (T2), with a transition in between them. You should also note that the first target, which is approximately equivalent to that of /a:/ has closely spaced F1 and F2 either side of 1000 Hz and like /a:/ the higher formants are indistinct. The second target, which is similar to an /E/ is approximately mid-way between the spectrum of /I/ and /A/ (see above) and like those two vowels this target has clear and well separated F1, F2, F3 and F4. You will note that in this very careful articulation the second target is fully realised rather than being just a brief gesture, as it often is in diphthongs in connected speech. Note, however, that only F1 and F2 have stabilised values in the second target whilst F3 and F4 continue to rise during this target.
Figure 24: Broadband spectrogram of the vowel /ai/ from the token "hide". Formants are indicated by the yellow lines. Click anywhere on the image to hear the sound.
The first target of /ai/ has clearly separated F1 and F2, an indistinct F3 and a barely evident F4. It seems that there might possibly be a spectral zero just above F2 and also possibly between F1 and F2 (although this might be an analysis artifact). There also appears to be a spectral zero at about 3000 Hz.
The second target of /ai/ has clearly evident and well separated F1, F2, F3 and F4. Its likely that there is a spectral zero immediately above F1 which probably accounts for the steep upper slope of this formant.
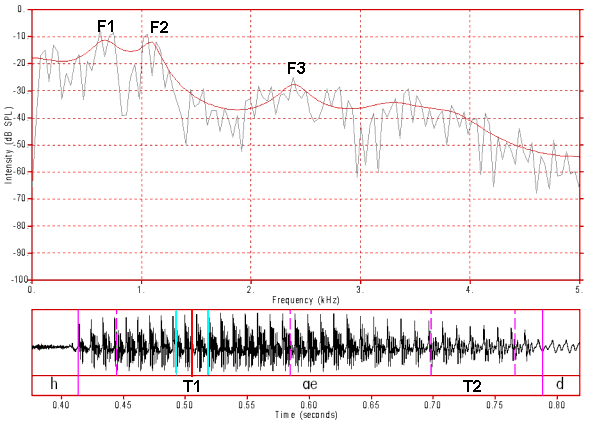
Figure 25: An FFT and LPC spectrum of target 1 of the vowel /ai/. The window is about 23 ms in length and the location of the window is shown by the vertical red and light blue lines. The LPC is calculated using 12 poles. Click anywhere on the image to hear the sound.
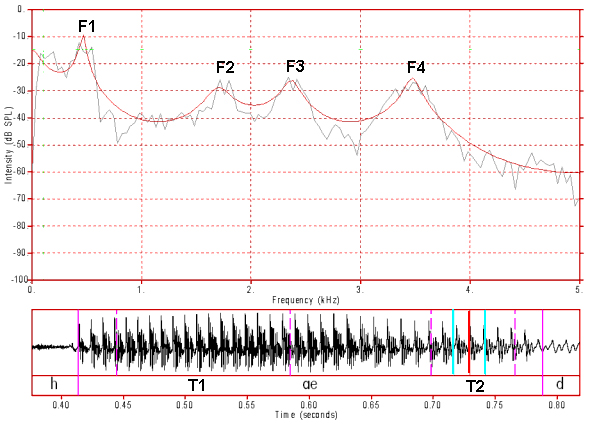
Figure 26: An FFT and LPC spectrum of target 2 of the vowel /ai/. The window is about 23 ms in length and the location of the window is shown by the vertical red and light blue lines. The LPC is calculated using 12 poles. Click anywhere on the image to hear the sound.
Content owner: Department of Linguistics Last updated: 12 Mar 2024 10:46am