Oral stops
Some consonant spectra
In the spectrograms discussed in this topic, clear formant tracks are marked with yellow lines. Formant transitions (movements) from a consonant to a vowel are important cues to place of articulation for many CV consonants. In this topic only CV consonants are illustrated. Consonants in other contexts (clusters, VC and VCV) are dealt with elsewhere.
The time scales are not constant in these diagrams. You are advised to take note of the time scale underneath each spectrogram before comparing temporal properties of the consonants.
FFT/LPC intensities are relative to an internally specified reference number. They should not be construed as signifying actual intensities in the original recording studio as this would require reference to an independent calibration signal. The dB values should only be interpreted as indicating relative intensities for spectrum components. For these particular spectra, -70 dB should be regarded as the floor or minimum level for these spectra and represents low level background noise. Such noise is a normal characteristic of the recording environment and the recording technology.
All of the spectrograms and FFT/LPC spectra used in this topic belong to the same adult male speaker of Australian English.
Robert Mannell
A pdf version of this topic is available.
a. Oral stops
For the oral stop samples provided below, as well as the spectrogram, there is an FFT/LPC spectrum of the stop burst for all stops, an FFT/LPC spectrum of the stop aspiration for the voiceless stops and an FFT/LPC spectrum of the stop occlusion of the voiced stops.
Like many stop bursts, the spectrum of this burst is quite flat, except for a low frequency peak at about 400 Hz.
The spectrum of the /p/ aspiration is quite flat. The three peaks might possibly, be back cavity formants. This spectrum is similar to, but more intense than, the spectrum of /f/.
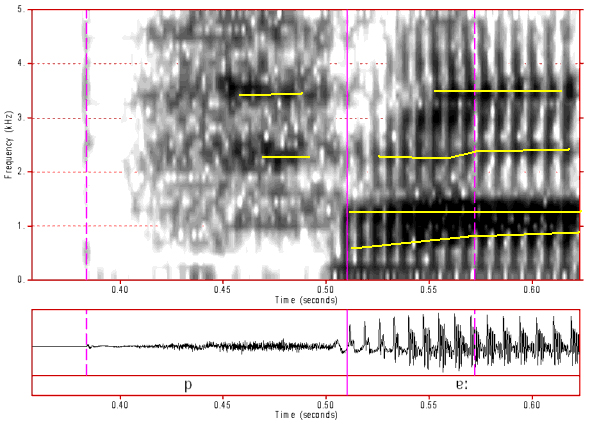
Figure 1: Spectrogram of /p/. Click anywhere on the image to hear the sound.
On of the more obvious differences between the waveform and the spectrogram of an oral stop is that burst waveforms tend to be quite unclear whilst the burst is much clearer in the spectrogram. In this spectrogram the spectrum of the stop aspiration is similar to, but much stronger than, that in the spectrogram of /f/. We appear to see some formant structure in the latter half of the aspiration spectrum, presumably because as the aspiration progresses the constriction becomes wider and so the effect of the back cavity resonances become more clearly visible. The format transitions into the vowel are very similar to those in the spectrogram of /b/, because they have the same place of articulation. These transitions are also, to a lesser extent, similar to the transitions in the spectrograms of /f/ and of /v/, because they have a similar place of articulation.
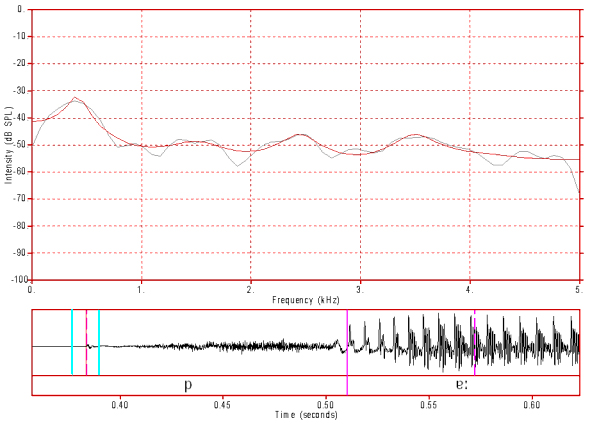
Figure 2: FFT/LPC spectrum of /p/ burst. Click anywhere on the image to hear the sound.
Like many stop bursts, the spectrum of this burst is quite flat, except for a low frequency peak at about 400 Hz.
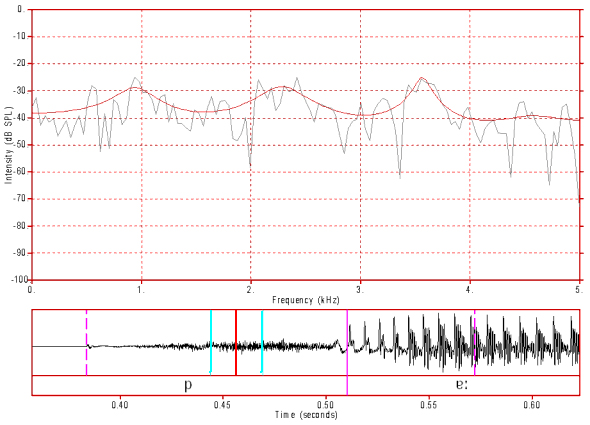
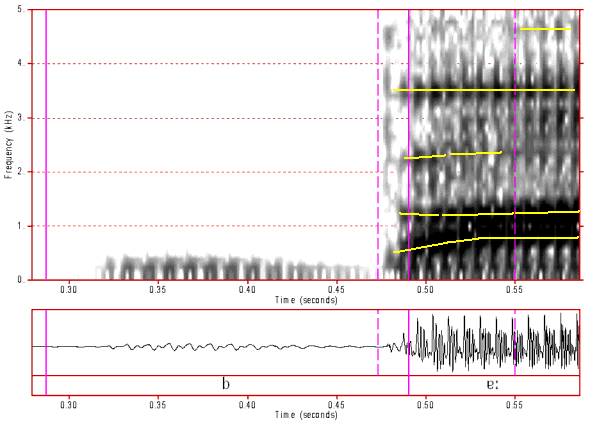
Figure 4: Spectrogram of /b/. Click anywhere on the image to hear the sound.
This is a spectrogram of a pre-voiced (-ve VOT) /b/ and the occlusion is characterised by what is often referred to as a "voice bar". A voice bar is a band of very low frequency voiced energy below about 200 Hz and represents those frequencies that are able to pass through the tissue of the walls of the vocal tract with minimal absorption. Higher frequencies are progressively more strongly absorbed by the tissue. The /b/ burst is very indistinct on the waveform but is quite clear on a spectrogram and appears as a vertical band spread fairly uniformly across the frequency range. The burst is followed by very minimal aspiration with simultaneous voicing. Voicing has reduced significantly in intensity by just before the burst, no doubt because of a reduction in the difference in pressure above and below the vocal folds, but it does not die out completely and it continues immediately following the burst.
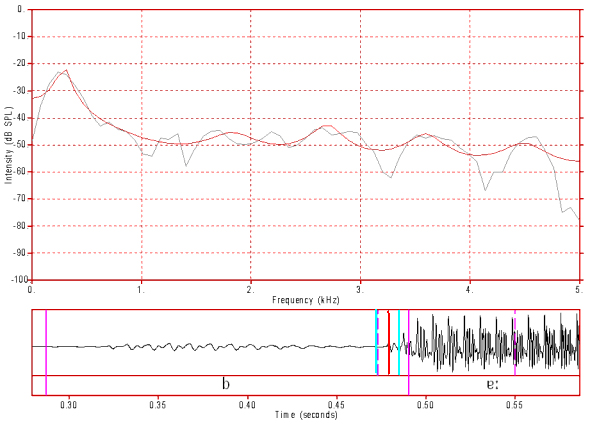
Figure 5: FFT/LPC spectrum of /b/ burst. Click anywhere on the image to hear the sound. The spectrum of the /b/ burst is mostly flat across all frequencies (averaging about -50 dB, or 20 dB above the noise floor) but has a similar low frequency peak to that found in the burst of /p/.
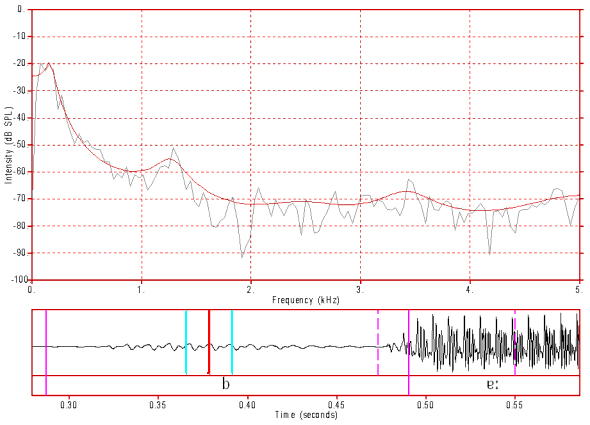
Figure 6: FFT/LPC spectrum of /b/ occlusion. Click anywhere on the image to hear the sound. Here we can see the actual spectrum of the "voice bar" during the occlusion of a pre-voiced stop. Only frequencies below about 200 Hz pass through the vocal tract walls mostly unattenuated. The absorptivity of the vocal tract walls to sound increases continuously above 200 Hz so that very little sound radiates out of the back cavity above about 800 Hz and by about 1400 Hz the spectrum is level with the noise floor at -70 dB. Note that a wider analysis window than the one used here reveals a strong harmonic spectrum up to about 1400 Hz.
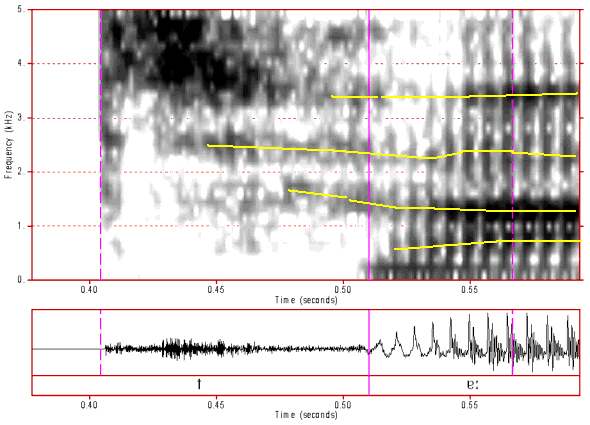
Figure 7: Spectrogram of /t/. Click anywhere on the image to hear the sound.
In this spectrogram we can see a strong burst followed by a significant aspiration about 0.1 seconds in duration. The spectrum of the aspiration has a strong band of energy above about 3500 Hz, which is similar to the latter part of the spectrum of /s/. We can also see some formant bands in the aspiration which become progressively clearer (presumably as the constriction opens). The formant transitions can be seen in this spectrogram to commence in the aspiration phase and to continue into the vowel. These transitions are reasonably similar to those in the spectrogram of /s/, but the F2 transition in this spectrogram starts higher, at about 1800 Hz (which is what we would predict for the F2 onset following an alveolar).
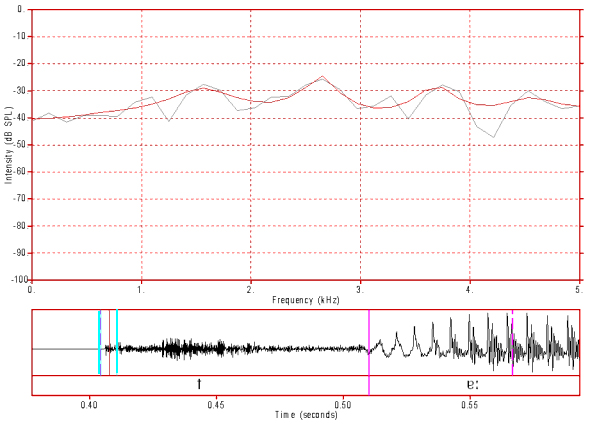
Figure 8: FFT/LPC spectrum of /t/ burst. Click anywhere on the image to hear the sound.
Like many stop bursts the burst of /t/ is quite flat, but it is different from that of /p/ and/b/ in that it lacks to low frequency peak at about 400 Hz and has instead a dip in the spectrum around that frequency.
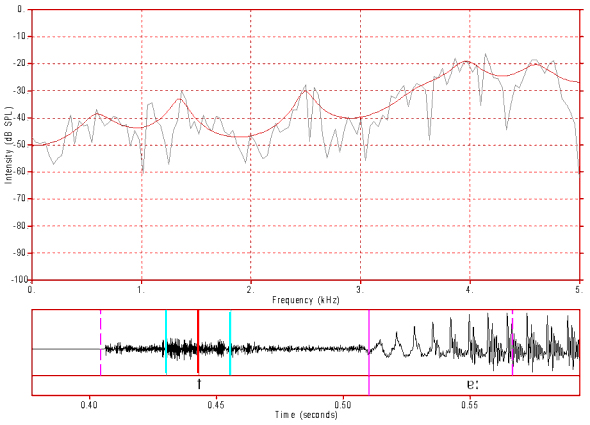
Figure 9: FFT/LPC spectrum of /t/ aspiration. Click anywhere on the image to hear the sound.
The /t/ burst spectrum has a similar high frequency peak above 4000 Hz as does the spectrum of /s/, but they are not identical. Further, this spectrum has some formant peaks at about 700, 1300 and 2500 Hz which may be back cavity resonances that are revealed as the constriction opens during the aspiration phase.
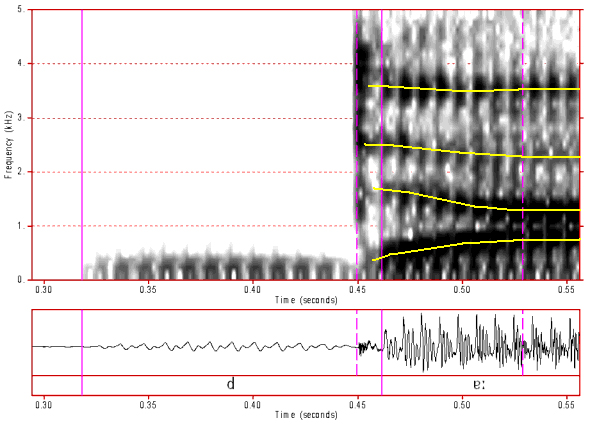
Figure 10: Spectrogram of /d/. Click anywhere on the image to hear the sound.
This spectrogram of a pre-voiced token of /d/ reveals a typical voice bar followed by a strong burst and by a clear pattern of formant transitions. These transitions take very similar paths to those in the /t/ spectrogram but you should note that all of the transition from /d/ occurs in the vowel, whereas in the /t/ spectrogram the transition pattern starts in the aspiration phase of the stop. Formant transitions are an important acoustic measurement of coarticulation as it allows us to track the resonance characteristics of articulatory movements. Both /t/ and /d/ should have very similar articulations, and therefore resonances, just before the burst. Following the burst the articulators move from the stop articulation at the moment before the burst to the target of the following vowel. For /d/, this all occurs during the vowel whilst for /t/ the movement is already occurring during the aspiration. This is also true for the other voiced/voiceless pairs of stops. We can identify voiceless stops from their aspiration spectra (which includes the first part of the formant transitions) but for the voiced stops we rely very heavily on the formant transition patterns (which occur almost entirely in the first part of the vowel) in order to identify the place of articulation of the stop.
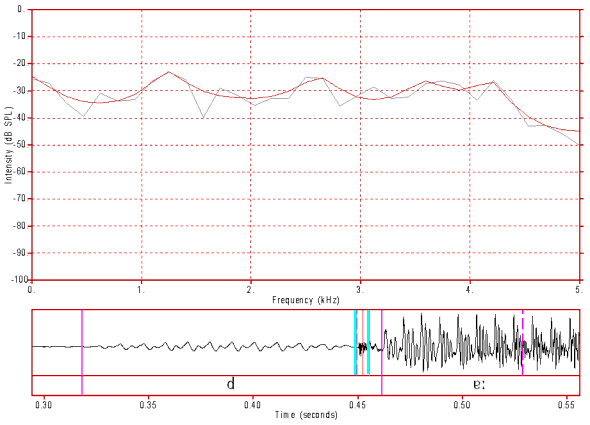
Figure 11: FFT/LPC spectrum of /d/ burst. Click anywhere on the image to hear the sound.
The burst of this /d/ token is quite similar to that of the /t/ token.
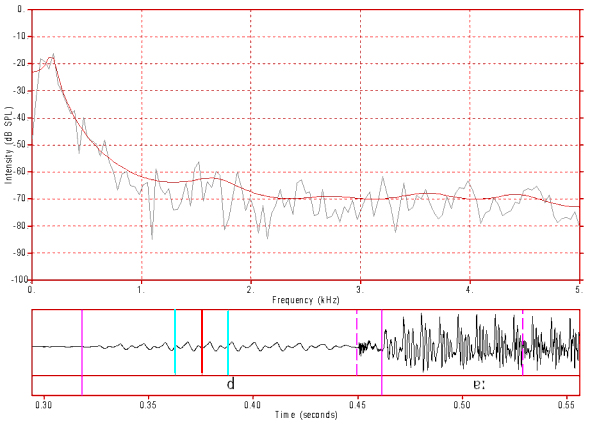
Figure 12: FFT/LPC spectrum of /d/ occlusion. Click anywhere on the image to hear the sound.
This is another typical voice bar spectrum for a voiced stop occlusion. Note that a wider analysis window than the one used here reveals a strong harmonic spectrum up to about 800 Hz.
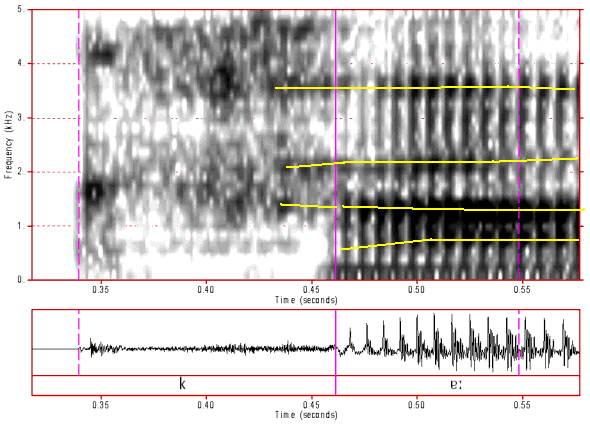
Figure 13: Spectrogram of /k/. Click anywhere on the image to hear the sound.
This spectrogram illustrates a common feature of the velar stop articulations of many speakers. That is, it shows a double burst with a weak first burst (presumably when a small part of the tongue separates from the roof of the mouth) then, shortly after, a stronger burst when the remainer of the tongue separates from the roof of the mouth. This is rather like a short trill release of the stop. Following the burst is a long aspiration phase of about 0.12 seconds which contains some formant structure. Such formant structure is normal for a velar place of articulation as the front cavity is quite long (consisting of the entire oral cavity anterior to the velum). We can also see that part of the formant transition structure occurs in the aspiration stage (as it did for the other voiceless stops and for /tS/). You should note that as the following vowel is a low central vowel, the place of articulation for this stop is most likely velar (rather than pre-velar next to front vowels, or post-velar next to back vowels).
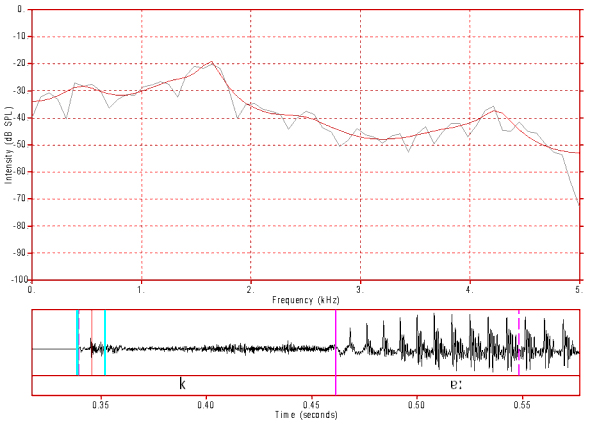
Figure 14: FFT/LPC spectrum of /k/ burst. Click anywhere on the image to hear the sound.
This burst spectrum is quite different to those of the alveolar and bilabial stops (and the postalveolar affricates). It has a particularly prominent peak at about 1500 Hz.
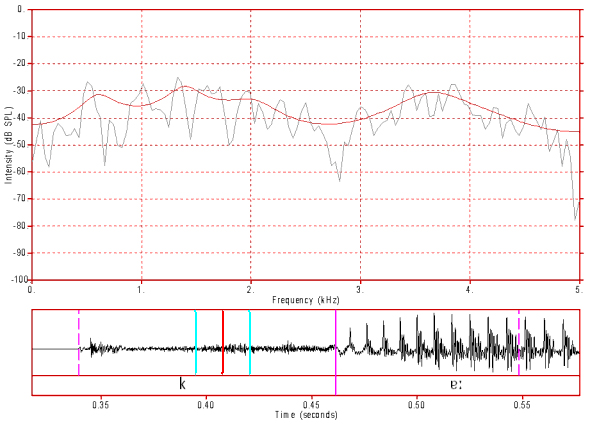
Figure 15: FFT/LPC spectrum of /k/ aspiration. Click anywhere on the image to hear the sound.
The aspiration spectrum of /k/ has two main peaks. The first one is between 500 Hz and about 2000 Hz whilst the higher peak is centred at about 3700 Hz. Its likely that the lower peak might be further divisible into two peaks centred at about 600 and 1600 Hz and perhaps a third peak just above 2000 Hz.
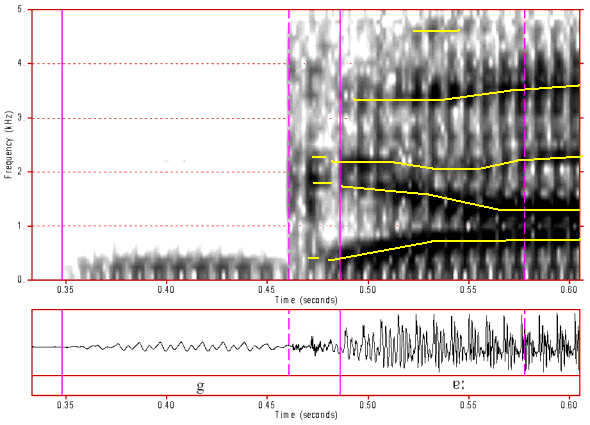
Figure 16: Spectrogram of /g/. Click anywhere on the image to hear the sound.
Like the other voiced stops, above, this stop is pre-voiced and the voice bar can be clearly seen in this spectrogram. As with /k/, there also appears to be a double burst here and the total burst duration is quite long for a voiced stop, being about 0.025 seconds. The transition patterns are similar to, but not identical to, those found in the /k/ token, above.
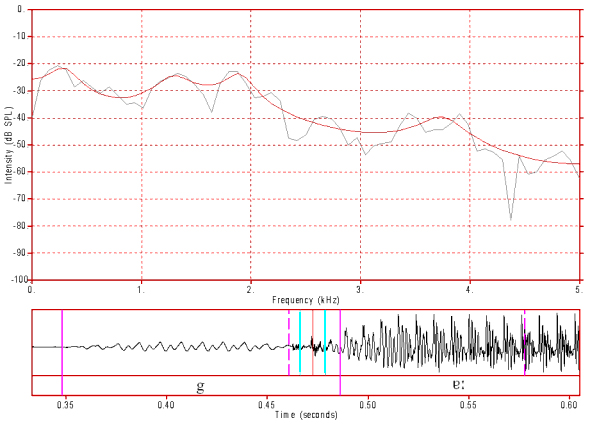
Figure 17: FFT/LPC spectrum of /g/ burst. Click anywhere on the image to hear the sound.
This burst spectrum is similar to that of /k/, above.
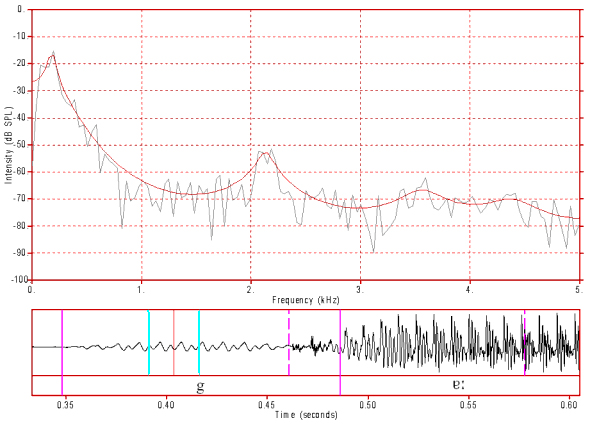
Figure 18: FFT/LPC spectrum of /g/ occlusion. Click anywhere on the image to hear the sound.
This spectrum has the typical voice bar spectrum with a peak at about 200 Hz. However, it also has a peak at about 2100 Hz which persists over most of the occlusion. This peak is most likely a consequence of a front cavity resonance.
Content owner: Department of Linguistics Last updated: 12 Mar 2024 9:47am