Nasal stops
Some consonant spectra
In the spectrograms discussed in this topic, clear formant tracks are marked with yellow lines. Formant transitions (movements) from a consonant to a vowel are important cues to place of articulation for many CV consonants. In this topic only CV consonants are illustrated. Consonants in other contexts (clusters, VC and VCV) are dealt with elsewhere.
The time scales are not constant in these diagrams. You are advised to take note of the time scale underneath each spectrogram before comparing temporal properties of the consonants.
FFT/LPC intensities are relative to an internally specified reference number. They should not be construed as signifying actual intensities in the original recording studio as this would require reference to an independent calibration signal. The dB values should only be interpreted as indicating relative intensities for spectrum components. For these particular spectra, -70 dB should be regarded as the floor or minimum level for these spectra and represents low level background noise. Such noise is a normal characteristic of the recording environment and the recording technology.
All of the spectrograms and FFT/LPC spectra used in this topic belong to the same adult male speaker of Australian English.
A pdf version of this topic is available.
d. Nasal stops
Nasal stops are sonorant consonants and so they have formant patterns that resemble those of vowels (to some extent). They also have a side resonance cavity, in this case the oral cavity, which opens into the pharynx but is closed at the lips (eg. bilabial) or the tongue (eg. alveolar or velar).
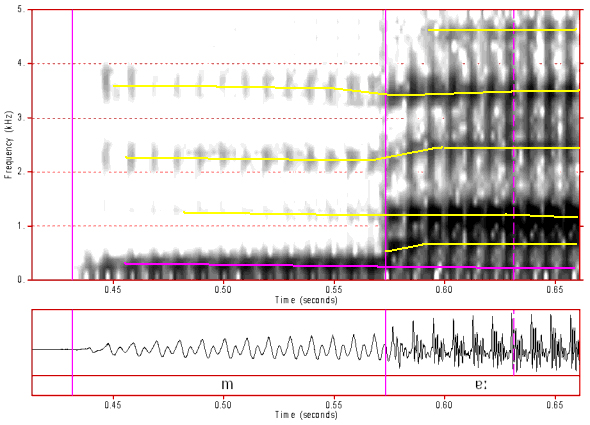
Figure 38: Spectrogram of /m/. Click anywhere on the image to hear the sound.
In this spectrum we can see a very strong low frequency resonance at about 200 Hz which is the main resonance of the nasal cavity. We can also see formant patterns that resemble vowel formants and are caused by the interaction between nasal and oral cavity resonances and antiresonances. The affect of having a main resonance chamber and a side resonance chamber is that the spectrum also consists of antiresonances which insert dips (rather than peaks) into the spectrum. These dips can cancel out or greatly diminish formant peaks. In this case the second formant appears to be particularly affected by such antiresonances. The formant transitions are similar to those for /p/ and /b/.
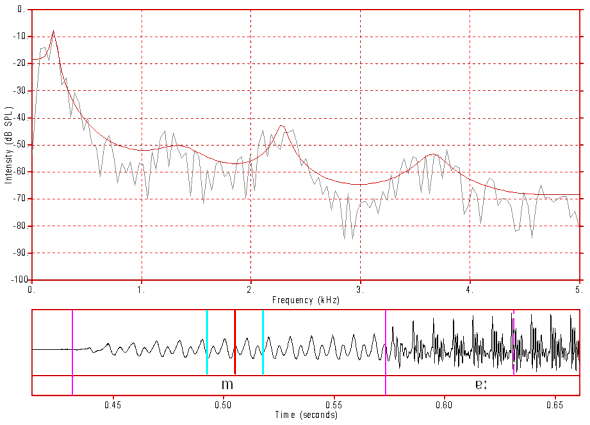
Figure 39: FFT/LPC spectrum of /m/. Click anywhere on the image to hear the sound.
Here we can see possible antiresonances at about 1000, 1800 and 3000 Hz. The antiresonances at 1000 and 1800 Hz have most likely greatly attenuated the second formant peak. The main nasal resonance is paired with an antiresonance (a pole-zero pair) that usually cancels out the oral tract F1 unless its very low (say 200 Hz) and therefore reinforced by the nasal resonance.
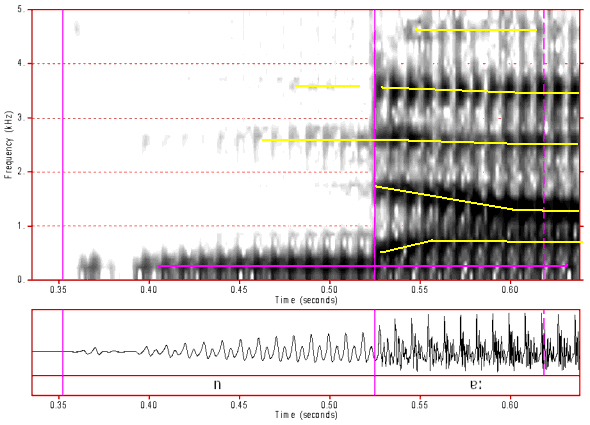
Figure 40: Spectrogram of /n/. Click anywhere on the image to hear the sound.
In the case of /n/, we can again see the strong nasal resonance at about 200 Hz. F3 is fairly evident, but both F2 and F4 are strongly attenuated by antiresonances. The formant transitions are characteristic of those for alveolar consonants and are similar to the transitions for /t/, /d/, /s/ and /z/.
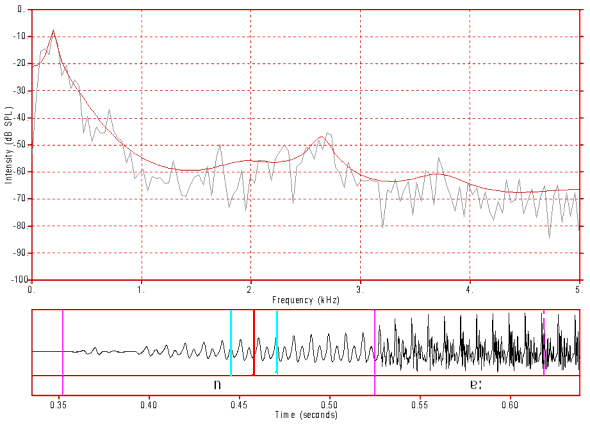
Figure 41: FFT/LPC spectrum of /n/. Click anywhere on the image to hear the sound.
The peak at 200 Hz is the main nasal resonance. Antiresonances between about 900 and 2000 Hz have almost completely obliterated F2 and antiresonances between 3000 and 4000 Hz have cancelled out F4. A weak F3 is still visible.
Content owner: Department of Linguistics Last updated: 12 Mar 2024 9:38am