Detailed views of "heed"
A print-formatted pdf file is available.
In this sub-topic we examine some detailed views of various aspects of the word "heed" as spoken by a male speaker of Australian English. This is done to illustrate the types of detailed analyses that we can make of a speech signal with a software package such as MU-spec.
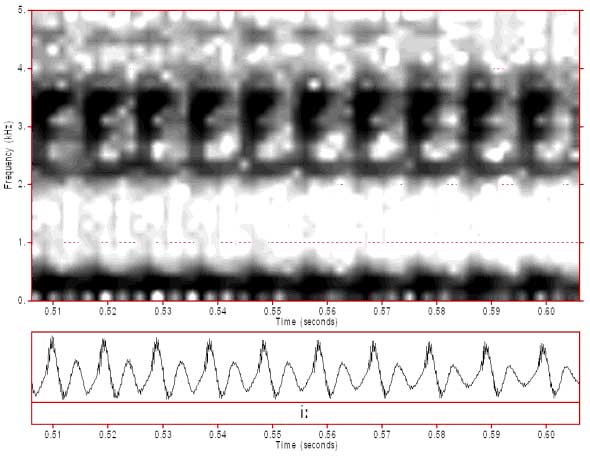
Figure 1: A detailed view of part of the vowel /i:/
In figure 1 you can see a close-up of several glottal cycles of /i:/. This gives you a more detailed view of the formant patterns and the way that they fluctuate in intensity with each glottal cycle.
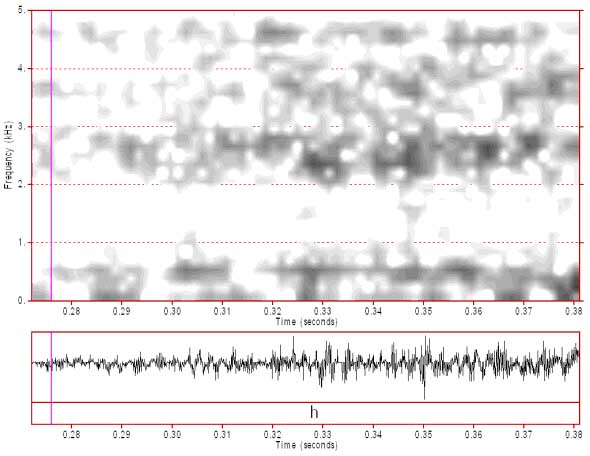
Figure 2: Close-up spectrogram of /h/
In figure 2 we see a close-up spectrogram of /h/. This spectrogram has no high frequency pre-emphasis so that the fricative spectrum is better displayed. In this image the formant pattern of /h/ is evident and approximately matches that of the following vowel /i:/.
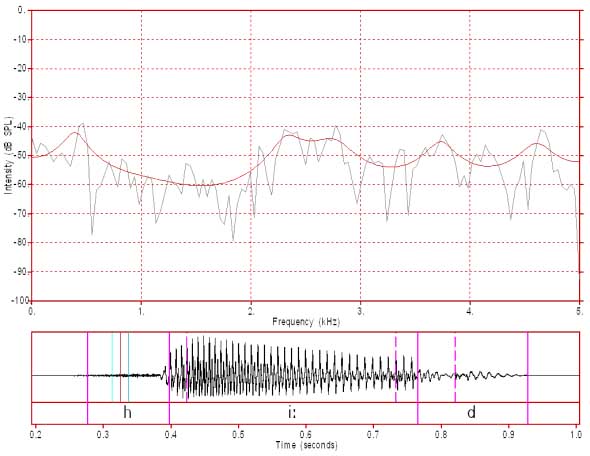
Figure 3: FFT/LPC spectrum of /h/ (51.2 ms analysis window)
Figure 3 displays an FFT/LPC spectrum of /h/ which shows an F1 at about 400 Hz, paired F2 and F3 at about 2350 Hz and 2720 Hz respectively, F4 at 3700 Hz and F5 at 4600 Hz. This formant pattern is similar to but not identical to the formant pattern for /i:/.
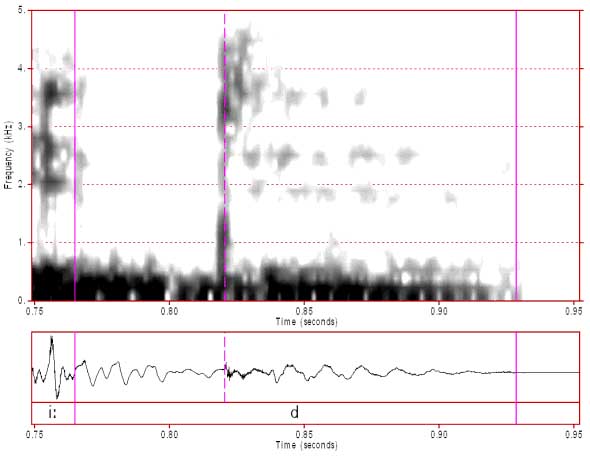
Figure 4: Close-up spectrogram of the /d/ in "heed"
One of the more obvious aspects of the image in figure 4 is that the /d/ occlusion is not very evident in the waveform, where low frequency voiced sound which has passed through the walls of the vocal tract continues throughout the waveform. In the spectrogram, on the other hand, we can clearly see the occlusion as nearly all of the energy is below 500 Hz. The rather small burst in the waveform is very prominent in the spectrogram, particularly at higher frequencies.
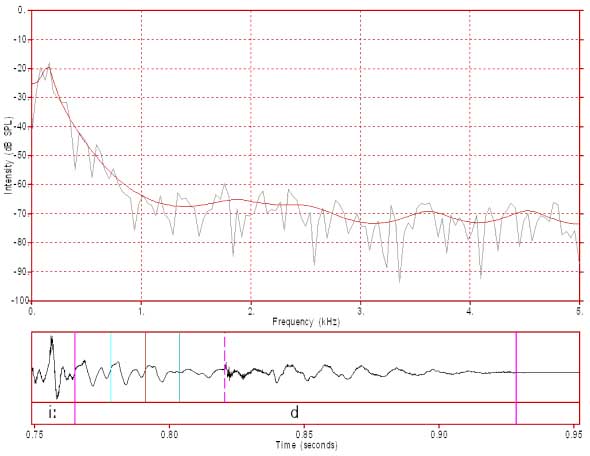
Figure 5: Spectrum of the occlusion of /d/ (25.6 ms window)
Figure 5 clearly displays the very strong predominance of energy below 500 Hz in the /d/ occlusion. Only the first 3-4 harmonics are well represented in this spectrum and above 1000 Hz the spectrum is about 50 dB below that of the peak (which is at about 150 Hz). The signal above 1000 Hz is more likely background noise rather than actual speech.
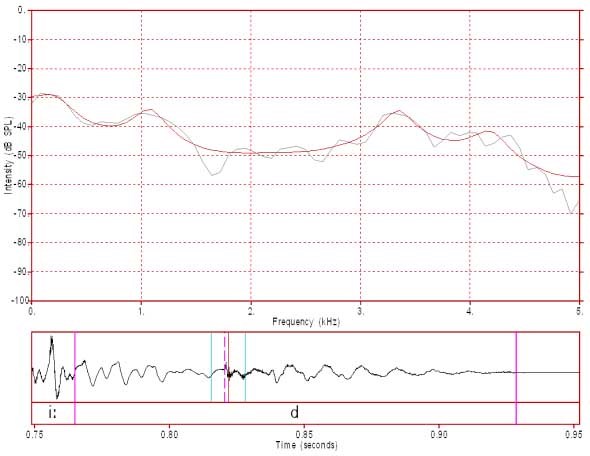
Figure 6: Close-up FFT/LPC of the /d/ burst.
In figure 6 we have a very short window (12.8 ms) centered over the /d/ burst. A stop burst tends to be very brief and to consist of broad peaks. A very short window is necessary when displaying a stop burst as longer windows will also display spectral characteristics of the adjacent occlusion and release.
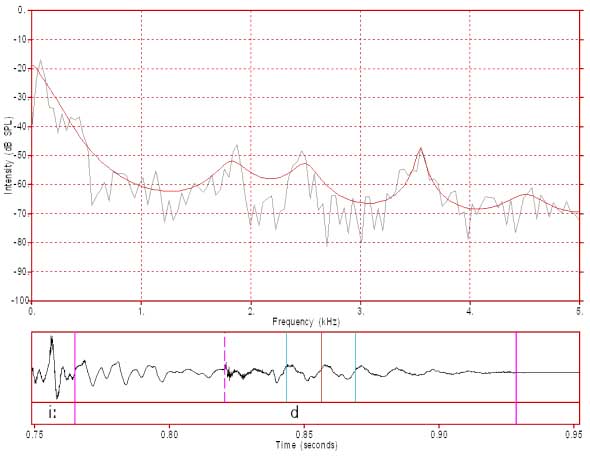
Figure 7: FFT/LPC spectrum of the /d/ release.
In figure 7 we can see from the waveform that the /d/ release is voiced. We can also see from the FFT/LPC spectrum that this phase has a clear formant pattern.
Content owner: Department of Linguistics Last updated: 12 Mar 2024 9:17am