Approximants
Some consonant spectra
In the spectrograms discussed in this topic, clear formant tracks are marked with yellow lines. Formant transitions (movements) from a consonant to a vowel are important cues to place of articulation for many CV consonants. In this topic only CV consonants are illustrated. Consonants in other contexts (clusters, VC and VCV) are dealt with elsewhere.
The time scales are not constant in these diagrams. You are advised to take note of the time scale underneath each spectrogram before comparing temporal properties of the consonants.
FFT/LPC intensities are relative to an internally specified reference number. They should not be construed as signifying actual intensities in the original recording studio as this would require reference to an independent calibration signal. The dB values should only be interpreted as indicating relative intensities for spectrum components. For these particular spectra, -70 dB should be regarded as the floor or minimum level for these spectra and represents low level background noise. Such noise is a normal characteristic of the recording environment and the recording technology.
All of the spectrograms and FFT/LPC spectra used in this topic belong to the same adult male speaker of Australian English.
A pdf version of this topic is available.
e. Approximants
Approximants are the most sonorant class of consonants. They share many characteristics of vowels including characteristic formant patterns.
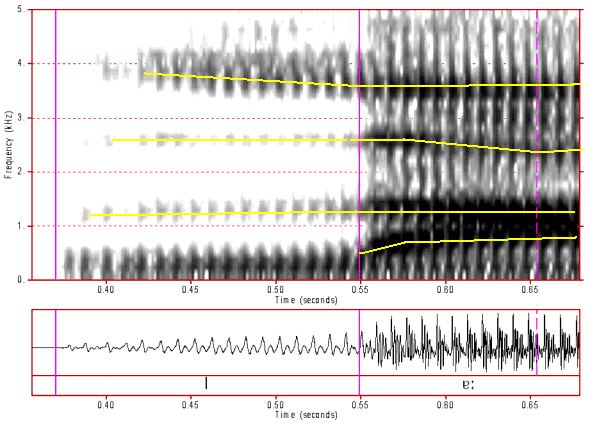
Figure 42: Spectrogram of /l/. Click anywhere on the image to hear the sound.
/l/ is a lateral approximant which means that it consists of two parallel resonance chambers either side of the tongue as well as a side chamber under the tongue that generate antiresonances that can attenuate some formants. In this spectrogram we can see that F1 and F4 are quite strong but that F2 and F3 are significantly attenuated. This attenuation is due to antiresonances at about 750, 2000 and 3000 Hz (see figure 43, below).
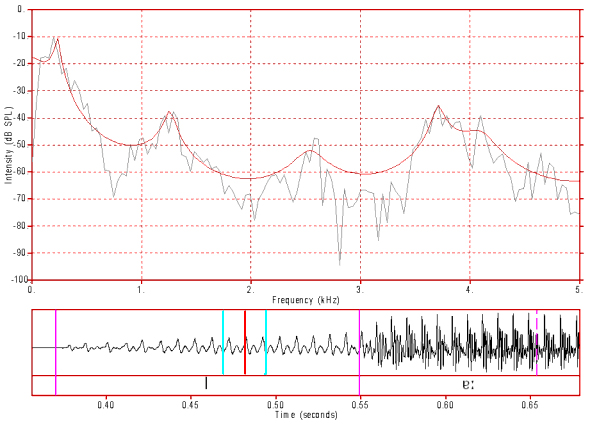
Figure 43: FFT/LPC spectrum of /l/. Click anywhere on the image to hear the sound.
In this spectrum we can clearly see antiresonances at 750 Hz, 2000 Hz and from 2800 to 3300 Hz. These antiresonances have affected the intensity of F2 and F3 and might have also affected their apparent frequency.
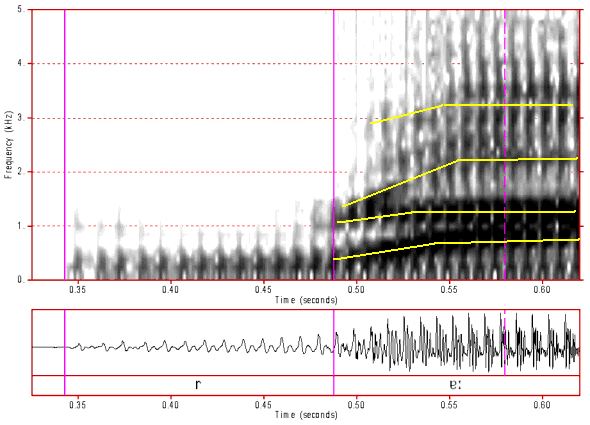
Figure 44: Spectrogram of /r/. Click anywhere on the image to hear the sound.
/r/ has a spectrum that is strongly weighted to the low frequency region. An /r/ can often be identified in a spectrogram by its characteristic steep F3 transition into the following vowel. F4 also has the steep transition curve, but to a lesser extent than F3. As the first three formants are compressed down into the lower frequency range, the higher formants are not visible in this spectrogram.
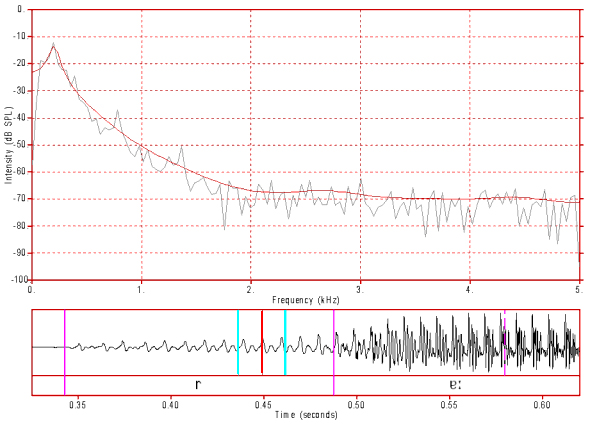
Figure 45: FFT/LPC spectrum of /r/. Click anywhere on the image to hear the sound.
In this /r/ spectrum we can see that the lower three formants have coalesced to form a low frequency feature with a peak at about 200 Hz and a slope down to the noise floor of this spectrogram.
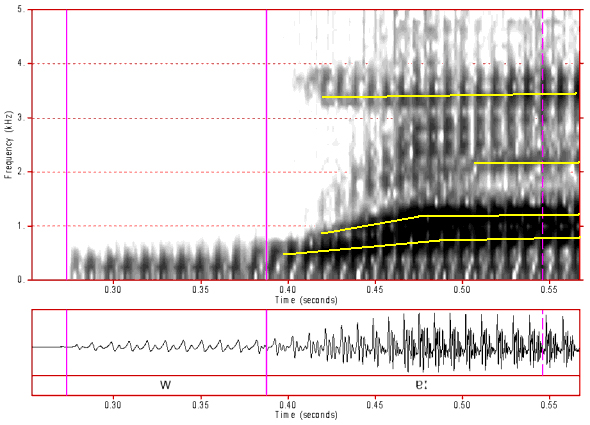
Figure 46: Spectrogram of /w/. Click anywhere on the image to hear the sound.
/w/ has a similar, but more constricted, articulation to a cardinal 8 vowel. That is, its similar to a constricted high back rounded vowel. Such vowels have, for a male speaker, an F1 of about 200 Hz and an F2 of about 800 Hz. The transitions in this spectrogram suggest that this is the case for this /w/ token. The other formants are not evident in this spectrogram and this is not unusual in spectra where F1 and F2 are both very low and close together.
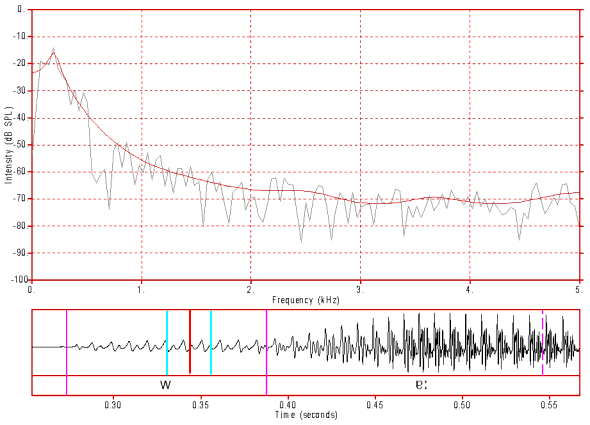
Figure 47: FFT/LPC spectrum of /w/. Click anywhere on the image to hear the sound.
Here we can see an F1 at about 200 Hz and a possible, much weaker, F2 at about 800 hz. Note, however, that there is an antiresonance at about 600 hz that may have partially cancelled out F2.
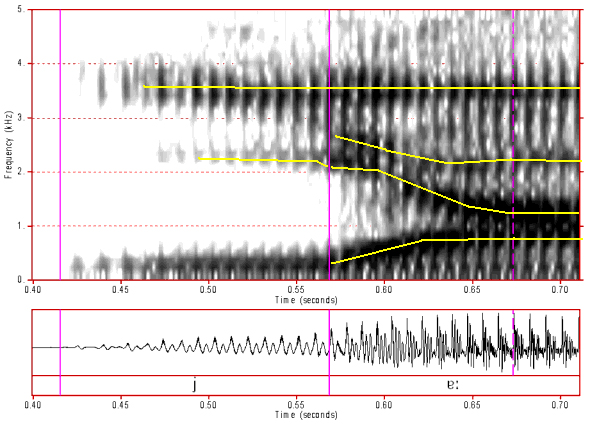
Figure 48: Spectrogram of /j/. Click anywhere on the image to hear the sound.
/j/ is similar to, but more constricted than, the vowel [i]. In this spectrogram we can see a low frequency F1 similar to that of an [i] vowel. There is an F2 at about 2200 Hz. The F3 transition suggests an F3 at about 2600 Hz (but this is very weak). Finally, there is a strong F4 at about 3500 Hz.
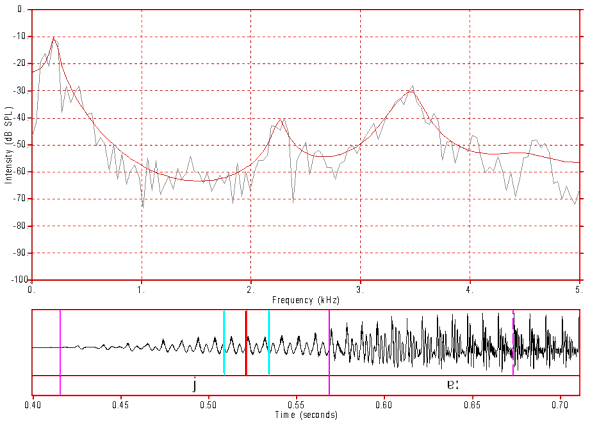
Figure 49: FFT/LPC spectrum of /j/. Click anywhere on the image to hear the sound.
This confirms the analysis of the spectrogram in figure 48. Additionally it seems evident that there may be an antiresonance at about 2800 Hz which would be responsible for canceling out F3.
Content owner: Department of Linguistics Last updated: 12 Mar 2024 10:46am