Affricates
Some consonant spectra
In the spectrograms discussed in this topic, clear formant tracks are marked with yellow lines. Formant transitions (movements) from a consonant to a vowel are important cues to place of articulation for many CV consonants. In this topic only CV consonants are illustrated. Consonants in other contexts (clusters, VC and VCV) are dealt with elsewhere.
The time scales are not constant in these diagrams. You are advised to take note of the time scale underneath each spectrogram before comparing temporal properties of the consonants.
FFT/LPC intensities are relative to an internally specified reference number. They should not be construed as signifying actual intensities in the original recording studio as this would require reference to an independent calibration signal. The dB values should only be interpreted as indicating relative intensities for spectrum components. For these particular spectra, -70 dB should be regarded as the floor or minimum level for these spectra and represents low level background noise. Such noise is a normal characteristic of the recording environment and the recording technology.
All of the spectrograms and FFT/LPC spectra used in this topic belong to the same adult male speaker of Australian English.
A pdf version of this topic is available.
b. Affricates
Affricates are often described as being intermediate between oral stops and fricatives. In other words, they are said to share features of both. They have occlusions and bursts like stops. They also have aspiration phases, like stops, but these are said to be fricative-like in duration. These features are certainly true for languages that discriminate phonemically between stops and affricates of the same place of articulation. This is not necessarily the case in English, where the apical stops are alveolar and the affricates are post-alveolar. That is these sounds have a place of articulation contrast. This reduces the need for these sounds to be distinguished by the duration of their aspiration phase.
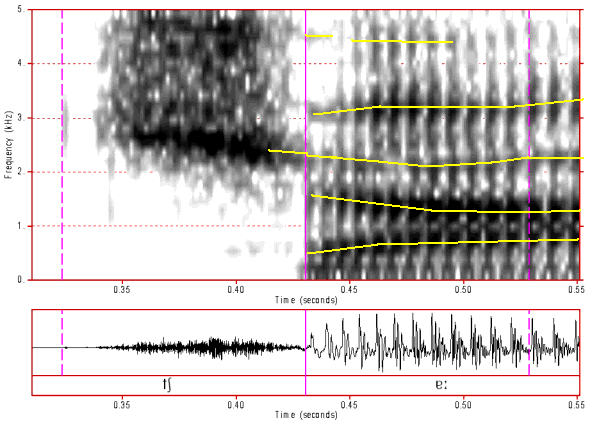
Figure 19: Spectrogram of /tS/. Click anywhere on the image to hear the sound.
In this spectrogram the /tS/ aspiration phase can be seen to be a bit over 0.1 seconds. This is very similar in duration to the aspiration phase of the three voiceless stops illustrated in the section on oral stops. An examination of the spectrogram of /S/ will show that the spectra of /S/ and the aspiration phase of /tS/ are very similar. The formant transition patterns are also quite similar for /tS/ and /S/.
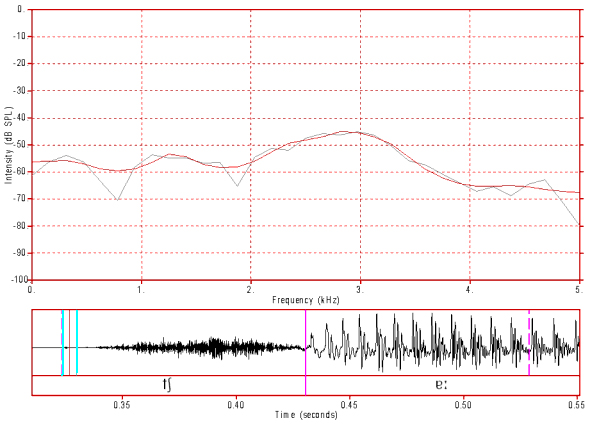
Figure 20: FFT/LPC spectrum of /tS/ burst. Click anywhere on the image to hear the sound.
Like many stop bursts, the /tS/ burst spectrum is relatively flat, but it does have a braod peak near the front cavity resonance peak seen in the aspiration spectrum, below.
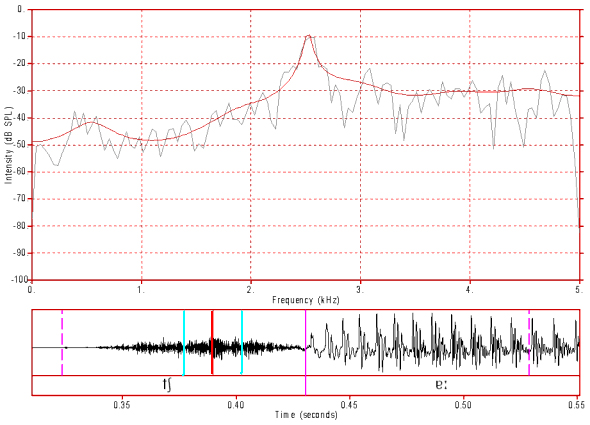
Figure 21: FFT/LPC spectrum of /tS/ aspiration. Click anywhere on the image to hear the sound.
The main peak in this spectrum, which corresponds to the fundamental resonance of the front cavity (between the constriction and the lips), peaks at 2500 Hz. This is very similar to the spectrum of /S/.
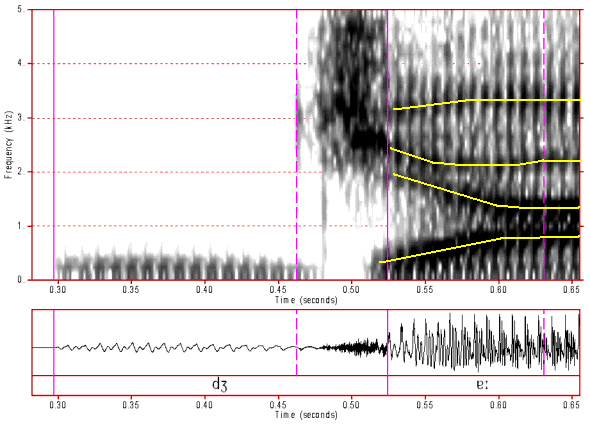
Figure 22: Spectrogram of /dZ/. Click anywhere on the image to hear the sound.
Several features are evident in this spectrogram. This is a pre-voiced sound (negative VOT) with about 0.15 seconds of voicing before the burst. This might be a characteristic of this speaker's careful articulation of these syllables in isolation. His voiced oral stops also have similar -ve VOTs. What is unusual about this sound (ie. when compared to the voiced oral stops) is the duration of its aspiration phase. A 0.05 seconds aspiration is quite long, twice as long as his /g/ aspiration and about 5 times longer than his aspiration for /d/ and /b/. This suggests that, unlike /tS/, /dZ/ could be said to share the features of a stop (occlusion and burst) and a fricative (an aspiration phase longer than for a voiced stop, and therefore more fricative like). Note, however, that this aspiration phase is voiceless.
You should also note that the format transitions are similar to those of /tS/ and /S/ as you would expect given that they all have the same place of articulation.
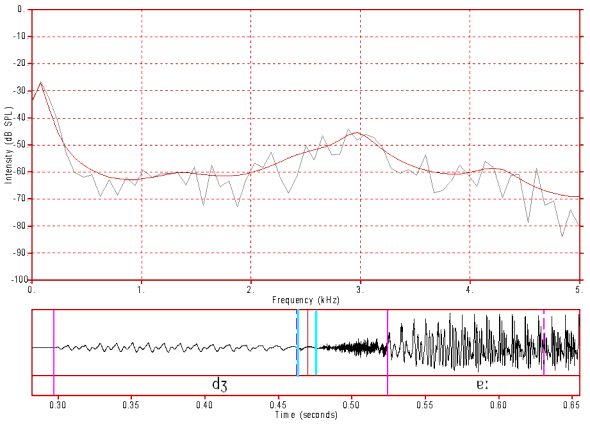
Figure 23: FFT/LPC spectrum of /dZ/ burst. Click anywhere on the image to hear the sound.
The spectrum of this burst is similar to that of the /tS/ burst, except that the burst coincided with some voicing and so there is also evidence of a voice murmur below about 250 Hz.
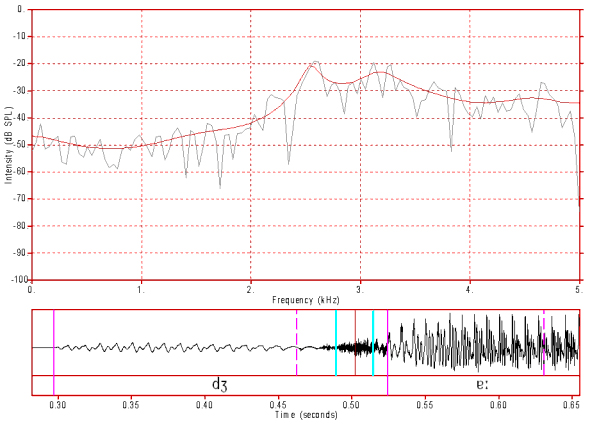
Figure 24: FFT/LPC spectrum of /dZ/ aspiration. Click anywhere on the image to hear the sound.
This spectrum is very similar to those of /S/ and /tS/, with its major resonance peak at about 2500 Hz.
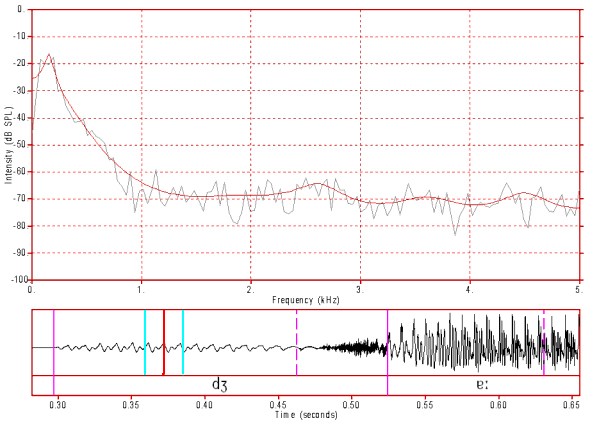
Figure 25: FFT/LPC spectrum of /dZ/ occlusion. Click anywhere on the image to hear the sound.
This spectrum is typical of that of any pre-voiced stop occlusion. Voicing during complete vocal tract closure passes out through the tissues of the wall of the vocal tract, but as higher frequency sounds are absorbed, only a low frequency murmur passes through the walls. As you can see, the amount of energy that passes through the walls of the vocal tract decreases steeply between 200 Hz and 1000 Hz. The energy level above 1000 Hz is about 50 dB below the peak level (and is effectively silence).
Content owner: Department of Linguistics Last updated: 12 Mar 2024 9:45am