Vocal Tract Resonance
A "neutral" vowel is defined as a vowel produced by a vocal tract configuration that has uniform cross-sectional area along its entire length. Whilst no vowel articulation can actually meet this requirement accurately, the vowel in "heard" and some productions of schwa can approximate this configuration. For such vowels, and only for such vowels, the vocal tract can be treated mathematically as a single uniform tube closed at one end (the glottis) and open at the other (the lips) for the purposes of calculating the resonances of the vocal tract. See the topic "Standing Waves and Resonance" for further details.
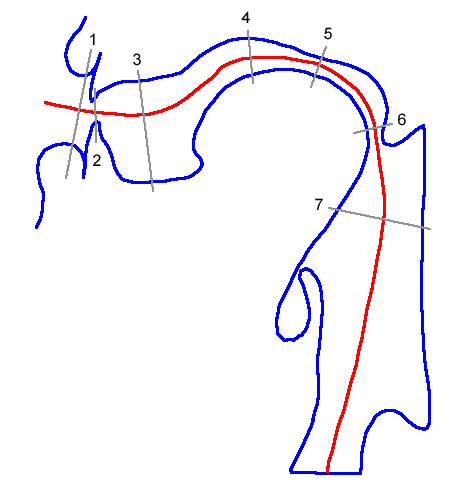
For all other speech sounds the configuration of the vocal tract is much more complex. Figure 1 displays an x-ray derived medial section of a vocal tract during the production of a high central spread-lipped vowel.
Figure 1: X-ray derived vocal tract medial section during the articulation of a high central spread-lipped vowel spoken by an adult male native speaker of Russian. The red line approximately represents the mid line of the vocal tract during this gesture and measurements of the cross sectional area were determined every 0.5 cm along this line from the lips to the glottis (see figure 3). Cross-sectional shapes were also determined for seven points along the vocal tract at the grey cross-section lines numbered 1 to 7 (see figure 2). (adapted from Fant (1960) , p 106)
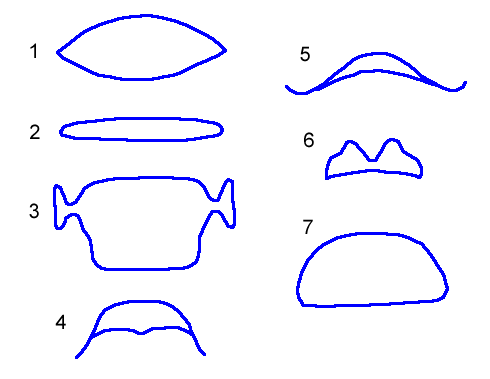
The actual cross-sectional shape of the vocal tract varies greatly along its length even during the production of a neutral vowel, but these variations in shape have an almost negligible effect on resonance. Cross-sectional area at each point is, on the other hand, the main predictor of vocal tract resonance. Most mathematical models of vocal tract resonance assume a circular cross-section shape with a cross-sectional area equivalent to that of the vocal tract at each measured point between the lips and glottis. Figure 2 displays seven cross-section shapes along the vocal tract taken from the equivalently numbered locations in figure 1.
Figure 2: Cross-sectional shape and area at the seven numbered points along the vocal tract indicated in figure 1. There is a great deal of variation in shape, but only the cross-section area and not the shape contributes strongly to vocal tract resonance. In most mathematical models of vocal tract resonance each of the above shapes is replaced by a circle (a short circular tube) with the same area. (adapted from Fant (1960) , p 106)
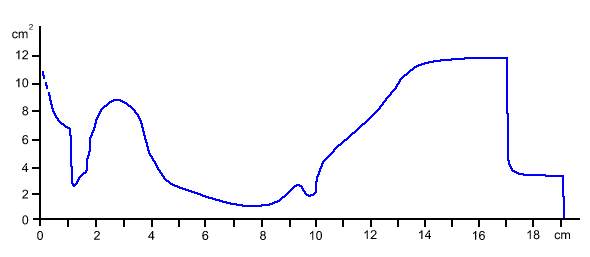
Figure 3 displays a graph of the cross sectional area of the vocal tract during the articulation illustrated in figures 1 and 2.
Figure 3: Smoothed graph of the cross-section area of the vocal tract during the articulation of the vowel displayed in figures 1 and 2. The y-axis is vocal tract area in square centimetres. The x-axis is the distance from the lips at each point, so the lips are to the left of the graph and the glottis is to the right. (adapted from Fant (1960) , p 106)
Tube Models of Vocal Tract Resonance
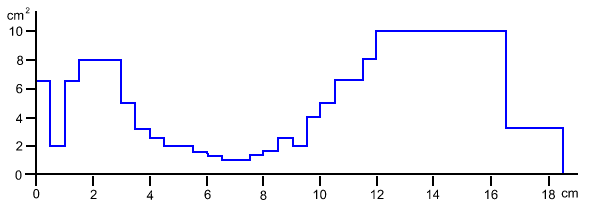
Figure 4 is an unsmoothed version of figure 3 which explicitly indicates the 0.5 cm steps between each measurement of cross-sectional area. These measurements were used to configure the settings for LEA, an electrical line analog speech synthesiser used by Fant (1960) in his calculations. This synthesiser was designed to simulate the resonance contributions of up to 45 sections of a vocal tract where each section was 0.5 cm in length. In other words, this system treated the vocal tract as a series of up to 45 tubes, each 0.5 cm in length.
Figure 4: Graph of the cross-section area of the vocal tract during the articulation of the vowel displayed in figures 1 and 2 with area measurements taken in 37 0.5 cm steps from the mouth to the glottis. The y-axis is vocal tract area in square centimetres. The x-axis is the distance from the lips at each points, so the lips are to the left of the graph and the glottis is to the right. (adapted from Fant (1960) , p 106)
Analog simulations of the vocal tract using electrical circuits in an analog computer can provide solutions to very complex configurations based on many circular tubes in series (up to 45 tubes in the case of Fant's LEA). Such systems are quite inflexible, however, and need to be specially built to perform a particular task. In other words, such systems are not general purpose computers. Mathematical solutions to such models are extremely complex and it has generally been found desirable to limit tube-based models of the vocal tract to much simpler models for use in calculation on modern digital computers. Typically, such models utilise from one to four tubes. The one tube case is limited to modeling the neutral vowel. Two and four tube models are often used for modeling vowels (other than the neutral vowel). A three tube model is often used for modeling consonants that have an oral constriction (eg. palatal and velar consonants).
Two Tube Vocal Tract Models of Vowels
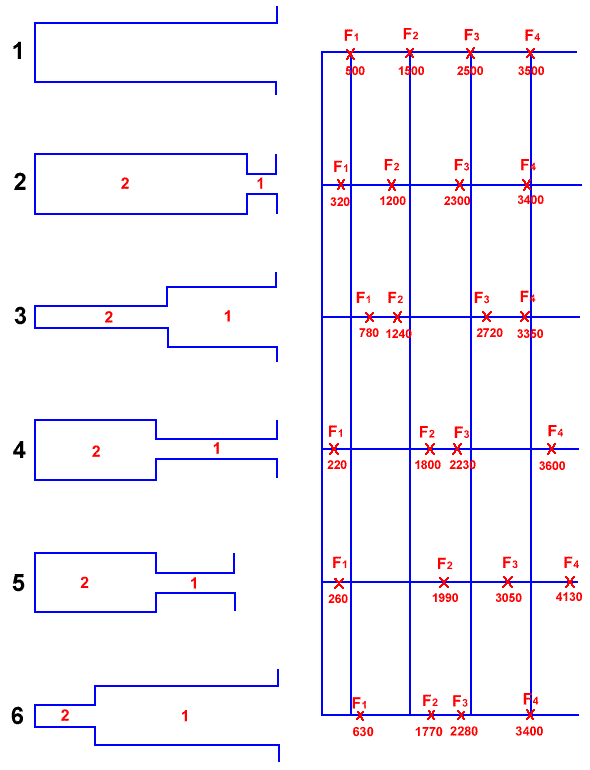
A two tube model of the vocal tract greatly simplifies the vocal tract's configuration. Firstly, like most tube models of the vocal tract, it ignores the curve of the vocal tract. The vocal tract is treated as having either a front or a back constriction. This results in two classes of vowel (for the purposes of this model), one class with a narrower front tube and one with a narrower back tube. Vowels within each class are distinguished by the relative lengths of the front and back tubes. Figure 5 displays two tube models for 6 vowels.
Figure 5: Two tube models for 6 vowels, [@, U, a, y, i, A] for vowel models 1 to 6 respectively (nb. these are ANDOSL vowel symbols). The left hand column shows the tube models for these vowels, with the glottis (closed) to the left and the lips (open) to the right. All vocal tracts except #5 have a length of 17.6 cm whilst #5 has a length of 14.5 cm. The right hand column shows the formant frequencies derived from this model. These results are reasonably good approximation of the actual vowels, except for #2. (adapted from Fant (1960) , p 66)
Whilst two tube models provide a reasonable estimate of formant frequencies for some vowels they tend to be quite inaccurate for other vowels. They also tend to not model rounded versus spread vowels very well and are unable to model more complex phenomena such as nasalised vowels. A more popular method is to model vowels using a four tube model.
Four Tube Vocal Tract Models of Vowels
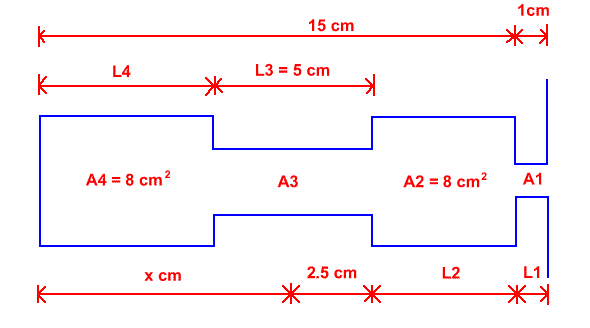
Four tube models of vowels provide a much better estimate of formant frequencies for a wider range of vowels than do two tube models and so are more a more popular method of modeling vowels. Such models consist of a lip tube (tube 1) a tongue constriction tube (tube 3) and unconstricted tubes either side of the constriction tube. This model is controlled by three parameters. They are i) the position of the centre of tube 3, ii) the cross-sectional area of tube 3, and iii) the ratio of the length to the cross-sectional area at the lip section. For extreme back constrictions tube 4 disappears whilst for extreme front constrictions tube 2 disappears.
Figure 6: A four tube model of a speaker with a 15 cm vocal tract. This model is controlled by three parameters: i) the position of the centre of tube 3 relative to the glottis (x cm), ii) the area (A3) of the tongue constriction, and iii) the ratio (L1/A1) of the length (L1) over the area of the lip tube. All other parameters are either fixed or can be easily determined from the control parameters and the fixed parameters. L3 is fixed to 5 cm except when the centre of tube 3 is less than 2.5 cm from either end of the vocal tract. In such cases L3 is reduced to maintain the total vocal tract length. (adapted from Fant (1960) , p 74)
Calculations of resonance frequencies using the 4 tube model are quite complex and so Fant (1960) supplied a (fairly complex) graphical representation of the relationship between the three parameters and the resultant formant frequencies. These graphical representations are called nomograms. The original versions of these nomograms supply, for a continuous range of x constriction positions (ie. distance from the centre of the tongue constriction to the glottis) a continuous range of resultant F1 to F5 values. The original nomograms do this for 5 values of lip area (A1) and for two values of tongue constriction cross-sectional area (A3). For different vocal tract lengths, different nomograms need to be computed.
The four tube, three parameter, model provides a sufficiently accurate prediction of most vowel sounds, but cannot model nasalisation of vowels.
Three Tube Models of Consonants
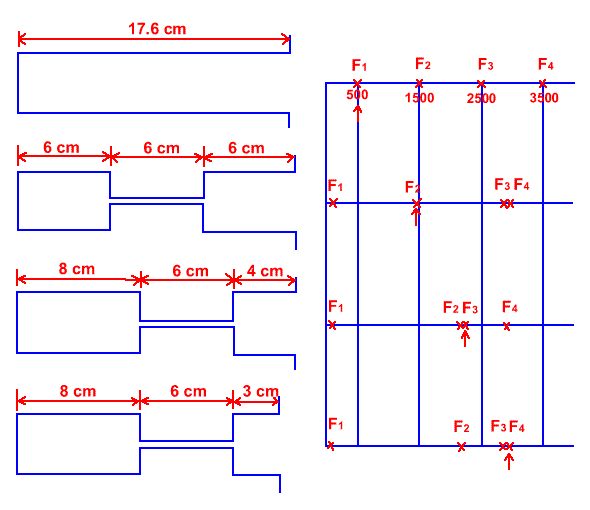
Tube models can also be used to predict consonant resonance patterns. The simple three tube model can provide a reasonable prediction of the resonance patterns of consonants, especially consonants with a tongue constriction and no nasal resonance.
Figure 7: Three tube models of consonant resonance (compared to a single tube model of a neutral vowel). This diagram shows the results for some models of velar and palatal consonants. The arrow in each case points to the fundamental resonance of the front cavity. (adapted from Fant (1960) , p 73)
Additional Models of Vowels and Consonants
The methods outlined above cover a number of simple tube models of vowels and consonants. More complex models are also possible. For example, Fant (1960) also uses horn models that utilise sections that have variable cross-section (rather than simple uniform tubes). He also discusses additional models that can account for anti-resonances (zeros) that put dips into consonant and vowel spectra as a consequence of the effects of other resonating cavities (such as the nasal cavity or the back cavity in a fricative). These models are outside the scope of the current topic.
Vocal Tract Transfer Functions
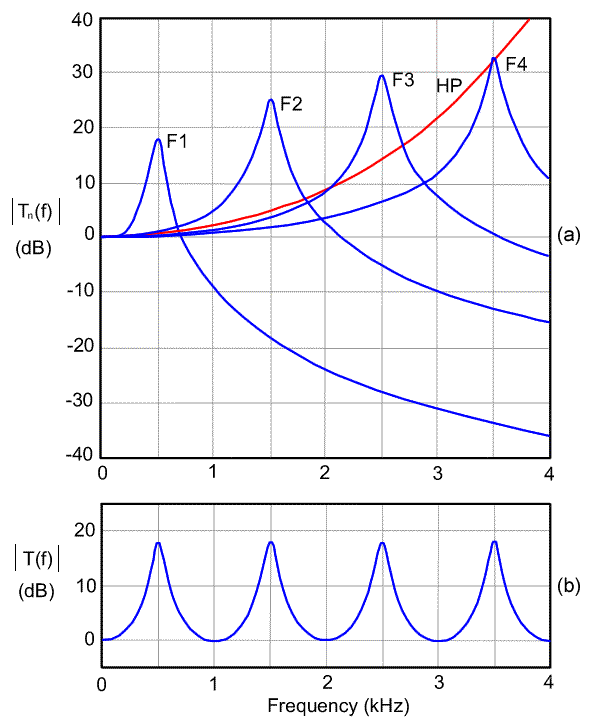
Once we have predicted the main vocal tract resonances using one of the above models, we then need to determine the overall shape of what is know as the vocal tract transfer function. The vocal tract transfer function predicts vocal tract resonance patterns across the spectrum for a particular articulation. We build up a picture of the total VT transfer function one resonance at a time using a standard mathematical model of the resonance pattern of each individual resonance. Figure 8 illustrates one such model.
Figure 8: Vocal tract transfer function. In the top panel is displayed the individual transfer functions of the first four resonances of a neutral vowel. The first four resonances will result in the first four vowel formants and are so labeled. A fifth red curve (labeled HP) provides a correction that accounts for all higher resonances. The bottom panel is the entire vocal tract transfer function for this vowel and is obtained by adding the dB values (or multiplying the linear intensity values) of the individual resonance transfer functions. This results in a spectrum where the peaks of the individual resonances are identical, if we assume that the bandwidths of each resonance curve is the same. (adapted from Stevens (1998) , p 133)
Peak Width and Resonance Damping
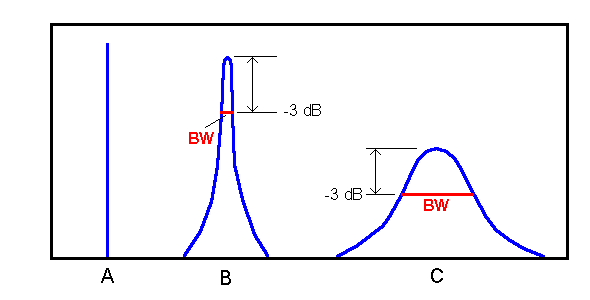
Each individual resonance transfer function starts at 0 dB at 0 Hz and rises using identical curves to reach a peak at its resonance frequency and then the curve declines at the same rate. This is actually a simplification as it assumes that each resonance has the same bandwidth. Bandwidth is a function of damping. A resonance with zero damping a) rings forever, and b) has zero bandwidth. A weakly damped resonance rings for a long time but eventually dies out and has a very narrow bandwidth. A strongly damped resonance rings for a short time, dies out quickly and has a broad bandwidth. Resonances in the vocal tract are damped to the extent that the walls of the vocal tract absorb energy. As frequency increases the walls of the vocal tract more efficiently absorb energy for that frequency. Only very low frequencies pass relatively freely through the walls of the vocal tract. As a consequence low frequency resonance peaks have narrower peaks and the bandwidth of the peaks increases as frequency increases. A side effect of this is that as frequency increases the height of each resonance peak decreases. Figure 9 illustrates spectral peak bandwidth and damping.
Figure 9: Spectral peak bandwidth and damping. Bandwidth is measured, by convention, 3 dB below the peak (this is the half intensity point). Peak A is completely undamped, has zero bandwidth and would ring forever. This peak is the spectrum of a sine wave. Peak B is weakly damped (eg. a tuning fork). It rings for a long time and has a narrow bandwidth (indicated by the horizontal red line). Peak C is strongly damped and rings for a short time. It has a wide bandwidth. Peaks B and C also illustrate another principle. That is, two peaks with the same energy have different peak heights (the one with the narrower bandwidth has a higher peak).
Predicting Speech Output Spectra
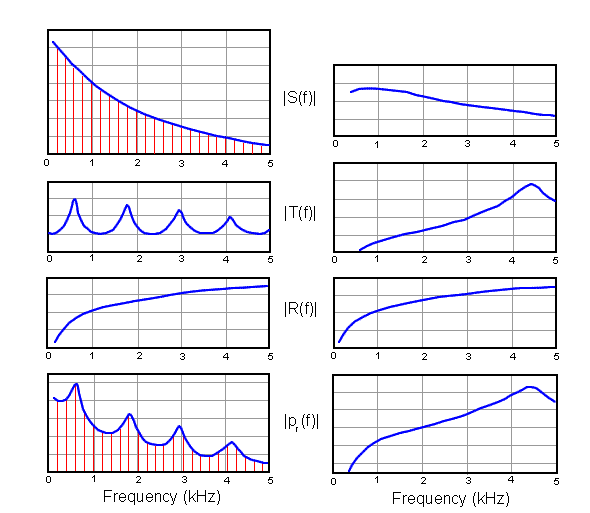
Speech output spectra (|Pr(f)|) can be predicted from three parameters:-
- source spectrum |S(f)|
- vocal tract transfer function |T(f)|
- lip radiation effect |R(f)|
For example, a voiced (modal voice) vowel has a source spectrum that slopes downward at
Figure 10: Comparison of the determination of the output spectrum for a neutral vowel and for a fricative. |S(f)| is the source spectrum, |T(f)| is the vocal tract transfer, |R(f)| is the lip radiation function and |pr(f)| is the output spectrum. Note that in the source and output spectrum of the vowel the blue line represents the spectral envelope whilst the red lines represent the individual voice harmonics. The differences in the height of the four resonances in the vowel vocal tract transfer function are due to slight differences in resonance bandwidth with increasing frequency. (adapted from Stevens (1998) , p 129)
Cavity Resonance Affiliation and Acoustic Coupling
Does each formant belong to a single cavity within the vocal tract? Its often said that F1 correlates (negatively) with tongue height whilst F2 correlates with tongue fronting (as defined by the cardinal vowel quadrilateral). Its another thing to say that F1 is the result of the back cavity resonance and that F2 is the result of the front cavity resonance. Because the two cavities are linked by a region of significant cross-sectional area then the acoustic properties of the two cavities interact. There is a low acoustic impedance between the two cavities. The resonances that generate these formants are therefore a result of the interaction between these two cavities.
The narrower the constriction between two cavities the greater the acoustic impedance. For example, the acoustic impedance between the front and back cavities during the occlusion of an oral stop is very large and so the two cavities can be treated as if they are uncoupled and their resonances are effectively independent. This is also true, but to a lesser extent, for the front and back cavity during a fricative. Coupled cavities exert an influence on the frequencies of each other's fundamental resonances by reducing or increasing those frequencies. These fundamental resonances are related to the length of the cavity and tend to be higher for short cavities and lower for long cavities but acoustic coupling can affect this to some extent.
Sometimes two formants are said to have "swapped cavity affiliation" (eg. F1 and F2 and the back and front cavities). This occurs because the formants F1 and F2 are defined so that F1 is always less than F2. It doesn't matter which cavity F1 comes from, as it is F1 because it is lower in frequency than F2. For some configurations the fundamental resonance of the back cavity is lower than that of the front cavity. In this case the resulting F1 is created by the resonance of the back cavity and the F2 is created by the resonance of the front cavity. As the position of the constriction moves backwards the back cavity becomes shorter and the front cavity becomes longer. As a consequence the back cavity resonance rises in frequency and the front cavity resonance falls in frequency. A point is reached where the back cavity resonance is higher in frequency than the front cavity resonance. At that point the back cavity resonance results in F2 and the front cavity resonance results in F1. The resonances have not swapped cavity affiliation, but they have swapped which formant they generate. Cavity resonance affiliation therefore does not swap even though F1 and F2 cavity affiliations do.
Readings
- Clark and Yallop, section 7.13 and 7.16
- Harrington and Cassidy, section 3.3 - 3.5
References
The following references provide in-depth overviews of the acoustics of speech production. Both books assume a mathematical background. The Fant book is considered to be the major classic of early speech acoustics research. Both books have been used as the inspiration for many of the diagrams used in this topic.
- Gunnar Fant, Acoustic Theory of Speech Production, Mouton: The Hague, 1960 (second printing, 1970).
- Kenneth Stevens, Acoustic Phonetics, MIT Press: Cambridge, Massachusetts, USA, 1998
Content owner: Department of Linguistics Last updated: 12 Mar 2024 9:28am

