Fricatives
Some consonant spectra
In the spectrograms discussed in this topic, clear formant tracks are marked with yellow lines. Formant transitions (movements) from a consonant to a vowel are important cues to place of articulation for many CV consonants. In this topic only CV consonants are illustrated. Consonants in other contexts (clusters, VC and VCV) are dealt with elsewhere.
The time scales are not constant in these diagrams. You are advised to take note of the time scale underneath each spectrogram before comparing temporal properties of the consonants.
FFT/LPC intensities are relative to an internally specified reference number. They should not be construed as signifying actual intensities in the original recording studio as this would require reference to an independent calibration signal. The dB values should only be interpreted as indicating relative intensities for spectrum components. For these particular spectra, -70 dB should be regarded as the floor or minimum level for these spectra and represents low level background noise. Such noise is a normal characteristic of the recording environment and the recording technology.
All of the spectrograms and FFT/LPC spectra used in this topic belong to the same adult male speaker of Australian English.
A pdf version of this topic is available.
c. Fricatives
For the fricative samples provided below, only a single FFT/LPC spectrum is displayed for the unvoiced fricatives. For the voiced fricatives two FFT/LPC spectra are displayed, one earlier in the fricative (where voicing strongly predominates) and one later in the fricative (where the fricative source tends to increase in strength).
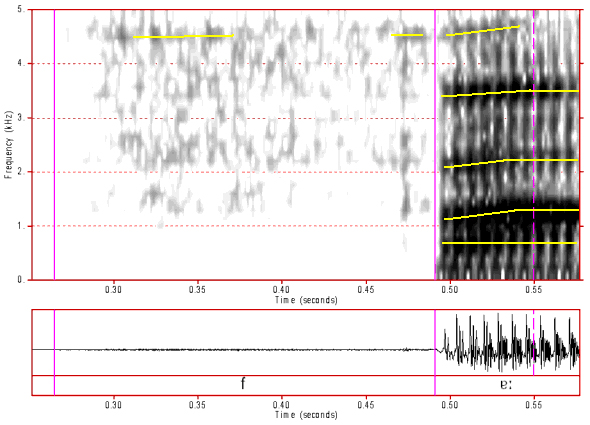
Figure 26: Spectrogram of /f/. Click anywhere on the image to hear the sound.
In this spectrogram we mainly see that /f/ has a very weak waveform and spectrum compared to the level of the vowel spectrum. The apparent weighting of the /f/ spectrum towards the higher frequencies is simply an artifact of the high frequency pre-emphasis applied to this spectrogram. The formant transitions shown here most likely don't reflect tongue movement but rather the effect of the changing shape and cross-sectional area of the lip aperture on the vocal tract resonances. The tongue has probably already anticipated and moved to the vowel articulation during the /f/ as tongue position is non-contrastive for /f/.
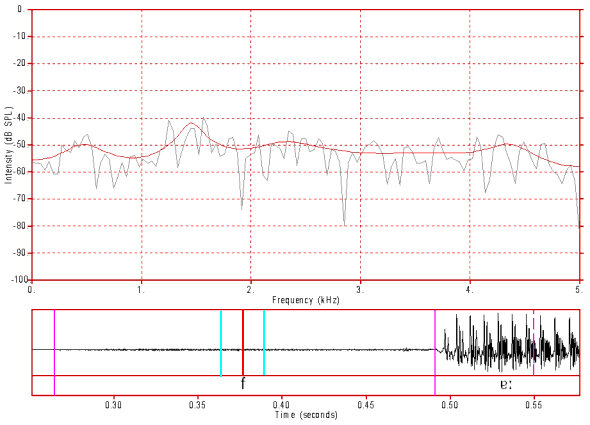
Figure 27: FFT/LPC spectrum of /f/. Click anywhere on the image to hear the sound.
This FFT/LPC spectrum confirms that the spectrum is a) mostly flat, b) quite level over this frequency range and c) quite weak. An average level of about -50 dB can be seen here and this is about 20 dB above the noise floor at -70 dB. You should note that we do expect a high frequency peak for this fricative, but its well above the cut-off frequency for this analysis (and is also above the nyquist frequency of this digital signal).
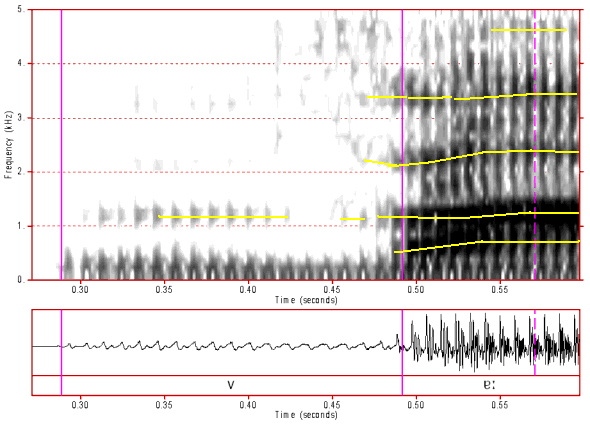
Figure 28: Spectrogram of /v/. Click anywhere on the image to hear the sound.
The transitions seen in this spectrogram are similar to those for /f/, above. Some formant structure can be seen in the /v/ spectrum, particularly a peak that appears to be equivalent to F2 in the early part of the /v/ spectrum. Vertical striations in the spectrum indicates the strong voicing of this consonant. In the last third of the /v/ there is evidence of some stronger fricative source components, especially at higher frequencies.
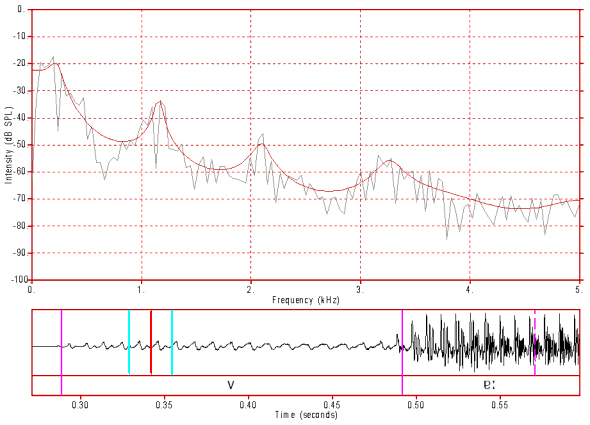
Figure 29: FFT/LPC spectrum early in /v/. Click anywhere on the image to hear the sound.
This FFT/LPC spectrum belongs to part of the consonant where the voicing component dominates and for which there is no strong evidence for a fricative voice source. We can see a strong formant pattern with clear F1, F2, F3 and F4 peaks. The spectrum is weaker than for a vowel and slopes gradually to the noise floor of the spectrum (at about -70 dB) by about 4000 Hz. This formant pattern mainly represents the resonance pattern of the rear cavity (ie. most of the vocal tract), but modified by the effects of a small lip aperture area. The harmonic pattern is not very clear in this spectrum, but when we use a broader analysis window (51.2 ms instead of the present 25.6 ms window) the harmonic pattern is quite clear up to about 1400 Hz. The constriction in this part of the /v/ is very likely not very small and so this a) limits the strength of the fricative sound source and b) permits rear cavity vocal tract resonance to more greatly affect the output sound quality. This effect is not as strong as for completely open lips, however, and this results in a steeper spectral slope with significant higher frequency attenuation.
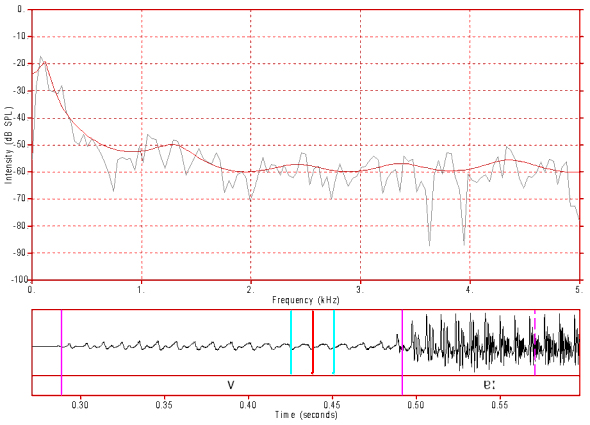
Figure 30: FFT/LPC spectrum later in /v/. Click anywhere on the image to hear the sound.
This FFT/LPC spectrum is taken from part of the /v/ where higher frequency noise seems to be stronger. In this spectrum we can see that the spectrum slopes steeply from about 100 Hz to about 700 Hz. This is typical for smaller constrictions which only permit the low frequency components of rear cavity resonance to pass through the constriction (and tissues). The flat fricative spectrum is between -50 dB and -60 dB (ie. its significantly above the noise floor) and above 700 Hz its similar to, but a bit weaker than the spectrum of /f/.
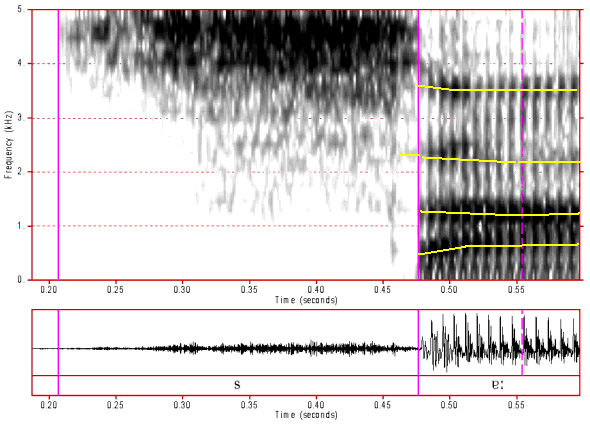
Figure 31: Spectrogram of /s/. Click anywhere on the image to hear the sound.
/s/, as a strident grooved fricative, is expected to have a much stronger fricative spectrum than weak fricatives such as /f/. This is confirmed in this spectrogram. This spectrogram also clearly shows that this fricative has a strong concentration of energy above about 4000 Hz. Further, its formant transition pattern is similar to that shown in the spectrogram of /t/, which is expected given that they have the same place of articulation.
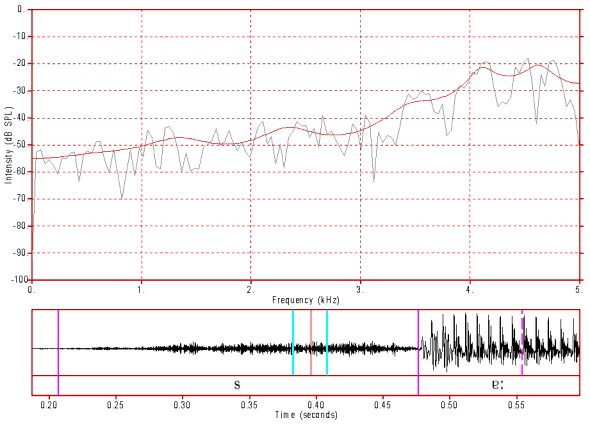
Figure 32: FFT/LPC spectrum of /s/. Click anywhere on the image to hear the sound.
This spectrum is quite similar to that of the weak fricatives, such as /f/, up to about 3000 Hz. Above that frequency it rises rapidly to a peak between 4000 Hz and 5000 Hz. This is a typical front cavity resonance for a consonant with a constriction at the alveolar ridge. A similar peak can be seen in the FFT/LPC spectrum of the /t/ aspiration.
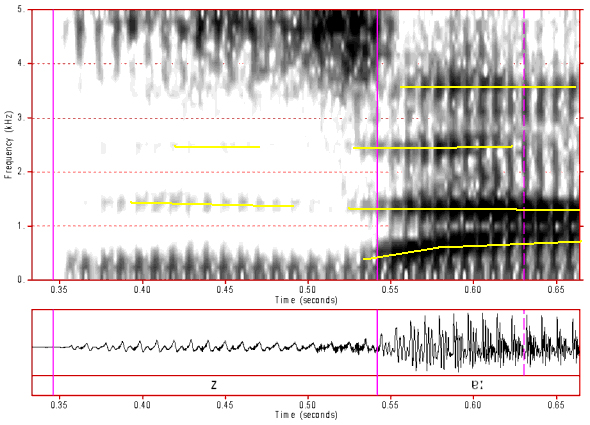
Figure 33: Spectrogram of /z/. Click anywhere on the image to hear the sound.
In this spectrogram we can see aspects of the spectrum that are similar to those of /s/ (ie. above 3500 Hz) as well as aspects of the spectrum that resemble the voice bars of the voiced oral stops. We can, however, also see some evidence of formants between 1000 Hz and 3000 Hz. There is some resemblance in the formant transition patterns to those of /s/ and /t/, but we would expect the F2 locus (ie. F2 target in the consonant) to be a bit higher and for there to be a slightly falling F2 transition into the vowel as occurs slightly in /s/ and more clearly in /t/. The apparent voicing striations above 4000 Hz in the spectrum of the early part of the /z/ is probably caused by voice source modulation of airflow patterns caused by the periodic opening and closing of the glottis (this is discussed in the sub-topic entitled "Voiced Fricative Sound Sources" in the page entitled "Sound Sources in the Vocal Tract").
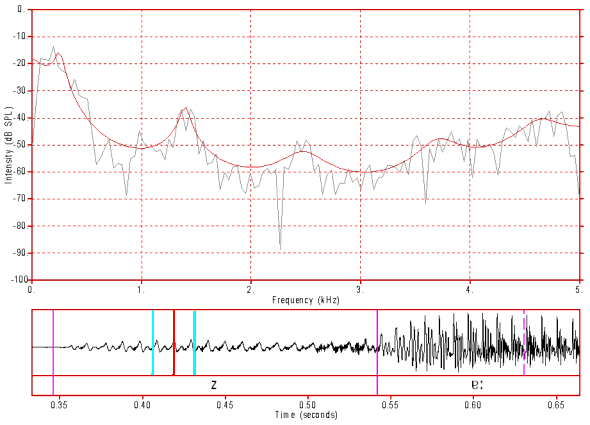
Figure 34: FFT/LPC spectrum mid way through /z/. Click anywhere on the image to hear the sound.
In this FFT/LPC spectrum, which is of an earlier part of the fricative before the frication strengthens, we see evidence F1, F2 and F3. This suggests that the constriction is not small enough to completely block the passage of the higher formant frequencies. From 3000 Hz and above we see a steadily increasing /s/ resonance spectrum, but its never as strong as it is in the spectrum in figure 35 (where its 20 dB higher). This weaker fricative intensity also supports the hypothesis that the constriction is more open at this point in the fricative than it is in the next figure.
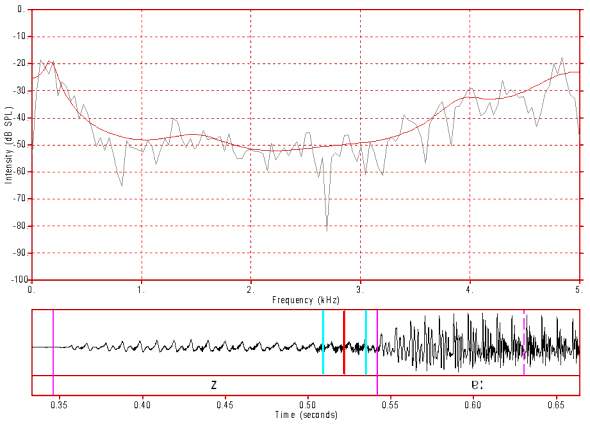
Figure 35: FFT/LPC spectrum near the end of /z/. Click anywhere on the image to hear the sound.
In this part of the /z/ the frication is very clear in the waveform. In the FFT/LPC spectrum there is no clear formant pattern. The low frequency voice bar is similar to that in the voiced stops. Both of these observations suggest that the constriction consists of a very small opening. Further, the /s/ resonance peak is 20 dB stronger than it was in the middle of the fricative (see figure 34) by about 20 dB.
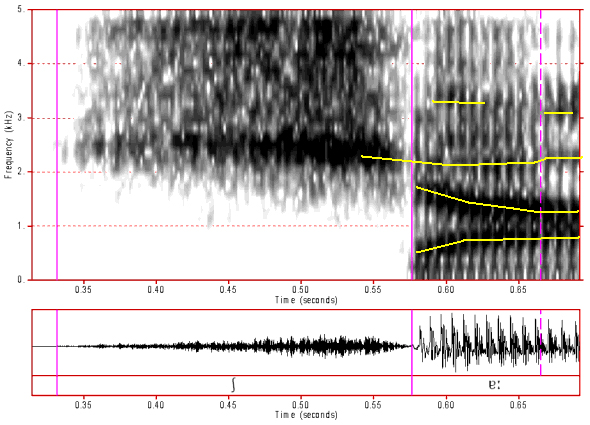
Figure 36: Spectrogram of /S/. Click anywhere on the image to hear the sound.
The /S/ spectrum, with its clear band at about 2500 Hz, is very similar to but much longer than the spectrum of the aspiration of /tS/ and fairly similar to the very much shorter aspiration of /dZ/. The formant transitions are also very similar to those of these two affricates.
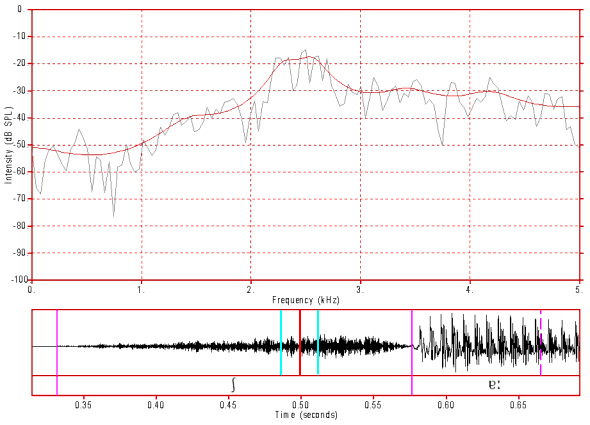
Figure 37: FFT/LPC spectrum of /S/. Click anywhere on the image to hear the sound.
The spectral peak coinciding with the fundamental resonance of the front cavity /S/ is at about 3500 Hz and is very similar to the main peak of the aspirations of /tS/ and /dZ/. This is a typical front cavity resonance for a postalveolar constriction.
Comparison of Front Cavity Resonance Frequencies
Note that the fundamental resonance for the longer front cavity of /S/ (from the lips to a position behind the alveolar ridge) is 3500 Hz whilst the fundamental resonance of the shorter front cavity of /s/ (from the lips to the alveolar ridge) is about 4000-4500 Hz. This is what we would expect. That is, the resonances of shorter tubes have higher resonances than those of longer tubes. This can also be seen with /f/ where the front cavity is the very small part of the vocal tract to the front of the lower lip, upper teeth constriction. For /f/ the fundamental resonance of this small front cavity is so high that it is well above the cut-off frequency for these spectra.
Content owner: Department of Linguistics Last updated: 12 Mar 2024 10:52am