Spectral Analysis
Complex Waves and Line Spectra
The addition of more than one pure tone produces complex waveforms. These waveforms are not readily analysed by eye as their shape varies according to the phase relationships of the various component tones. As complex waves increase in complexity it becomes increasingly difficult to determine anything from their waveform except for the fundamental frequency.
A line spectrum is a spectral representation that displays the frequencies and relative intensities of the component sine waves. Each sine wave is displayed as a single vertical line placed at the appropriate frequency on the x-axis. The height of the line represents the amplitude of the component sine wave. The amplitude is usually displayed as a relative sound pressure level (ie. in Pascals) or as a deciBel value. Phase information is absent in such a display. Given that phase is a perceptually insignificant (inaudible) component of a complex sound, such a display shows the perceptually significant components of the complex sound.
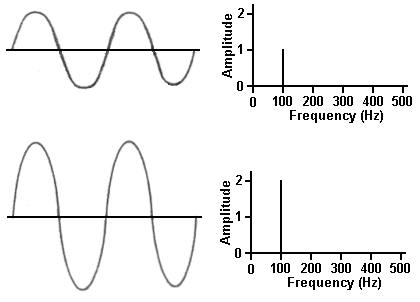
Figure 1: Line spectra of two simple tones of the same frequency but different amplitudes. In these examples the amplitude dimension displays sound pressure level in Pascals.
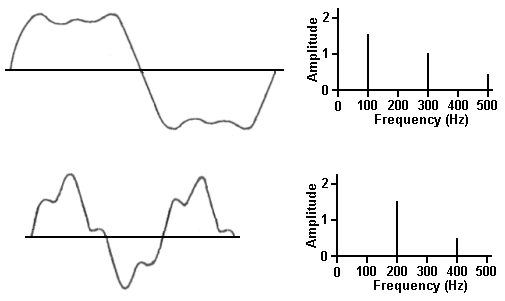
Figure 2: Line spectra of two complex tones. Note that the two complex spectra are created from tones with different ratios of frequency and amplitude.
Further Reading
- Clark and Yallop, section 7.8.
Fourier Transforms
The addition of pure tones (sine waves) results in a complex sound. A frequency analysis of such a sound often attempts to determine the original pure tones. The Fourier Transform was devised by the French mathematician Fourier in the 1820's and remains the primary method for carrying out frequency analyses of sounds and other phenomena. A number of different ways of performing the Fourier Transform have been developed including the Discrete Fourier Transform (DFT) and the Fast Fourier Transform (FFT) which are methods designed for working with digital signals (such as sampled speech).
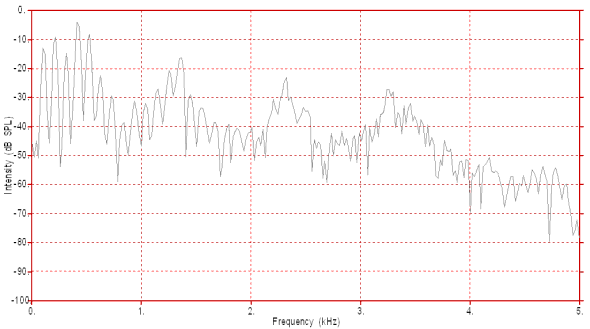
Figure 3: Fast Fourier Transform (FFT) of the vowel in the word "heard".
Further Reading
- Clark and Yallop, section 7.14
- Harrington and Cassidy, section 2.2.5
Linear Prediction Analysis
An FFT usually provides a great deal of fine spectral detail. In figure 3, above, the major spectral peaks (formants) which correspond to the resonant frequencies of the vocal tract are superimposed over the fine detailed harmonics (multiples of the fundamental frequency). Sometimes we wish to examine the overall formant pattern of a spectrum without the interference of a harmonic pattern (in voiced speech) or a random pattern (in voiceless speech).
Linear Prediction Coefficient (LPC) analysis attempts to predict the poles (related to resonances or formants) that, when combined with the speech source spectrum (the "residual" in LPC analysis), would result in the original waveform. An LPC analysis separates the analysis of the resonant characteristics of a speech sound from the source characteristics of that sound. The resulting LPC spectrum is a smoothed spectrum with the peaks representing the formants (resulting from the vocal tract resonances) of the spectrum of a vowel or vowel-like consonant.
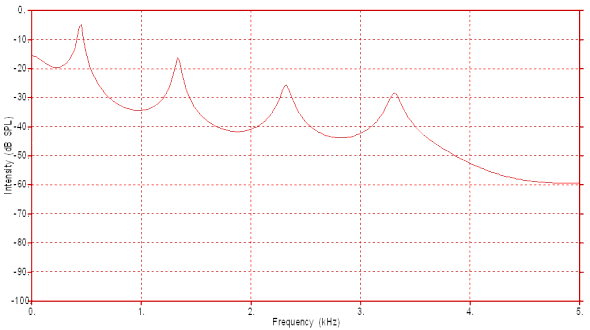
Figure 4: This is an LPC analysis of the vowel whose FFT analysis appears in figure 3. Note the smooth spectrum clearly showing the positions of the main spectral peaks (formants) of this vowel.
Further Reading
- Clark and Yallop, section 7.14
- Harrington and Cassidy, chapter 8 (this is a rather difficult chapter and is only recommended for students with a reasonable grasp of mathematics)
Filtering
In chemistry we can separated a solid from a liquid by passing a suspension (a liquid containing a suspension of small solid particles) through filter paper. The liquid passes through the paper and the solid is caught by the paper and fails to pass through. Filtering is the selective separation of one physical entity from another. We can also filter in acoustics. When we filter a complex sound we permit some frequencies to pass through the filter and we block other frequencies from passing.
A low pass (LP) filter permits frequency components below a specified frequency (cut-off frequency) to pass unattenuated and attenuates (blocks) frequency components above the cut-off frequency.
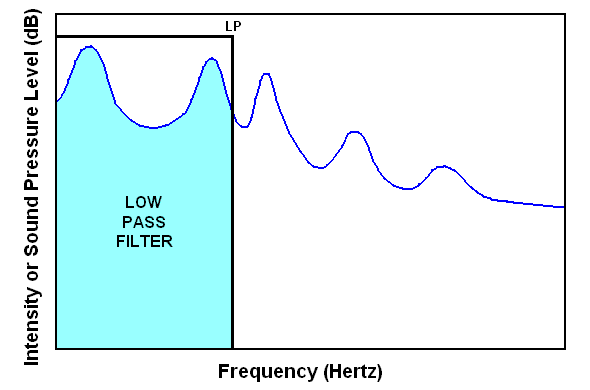
Figure 5: Low pass filter. "LP" indicates the low pass frequency. This filter passes spectral components below this frequency and blocks spectral components above this frequency.
A high pass (HP) filter permits frequency components above a cut-off frequency to pass unattenuated and attenuates frequency components below the cut-off frequency.
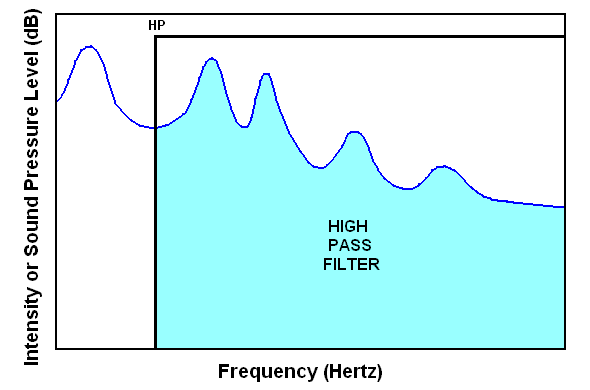
Figure 6: High pass filter. "HP" indicates the high pass frequency. This filter passes spectral components above this frequency and blocks spectral components below this frequency.
A band pass (BP) filter permits frequency components between two cut-off frequencies to pass unattenuated and attenuates frequency components below the lower (HP) cut-off frequency and above the higher (LP) cut-off frequency. The speech spectrograph consists of a series of BP filters.
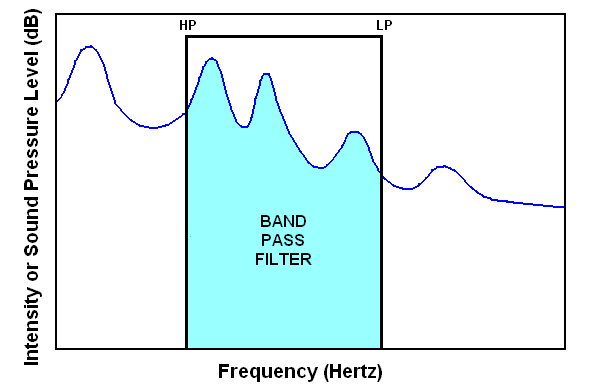
Figure 7: Band pass filter. "LP" indicates the low pass frequency and "HP" indicates the high pass frequency. This filter passes spectral components between these two frequencies and blocks spectral components outside this frequency range.
In most filters there is a region around the cut-off frequency where frequencies are partially allowed to pass. This provides a more gentle transition between the pass-band (the frequencies which are unattenuated) and the stop-band (the frequencies which are attenuated).
Two Dimensional Spectra: Frequency and Intensity
A two dimensional spectrum is effectively a snapshot of the spectrum of a sound at one point in time. This "point" in time is always a window of some length (greater than 1 sample, in digitised speech) centred over the analysis point. See the section on windowing.
In most cases a two dimensional acoustic spectrum will display amplitude on the vertical (Y) axis and frequency on the horizontal (X) axis. Most often the amplitude axis will be in deciBels (dB). The frequency axis is usually in Hertz (Hz) or kiloHertz (kHz). The spectrum is most often the result of an FFT or an LPC analysis. In the following example both an FFT and an LPC analysis has been carried out.
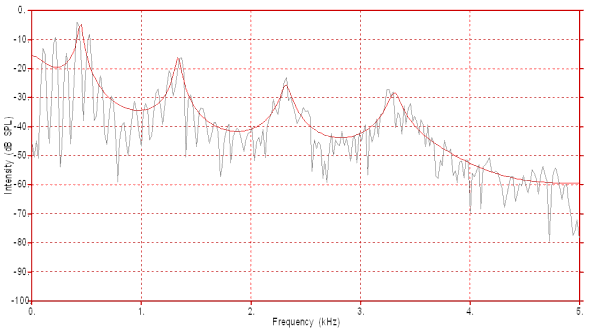
Figure 8: This is a combined FFT and LPC analysis of the vowel in heard. This analysis is of a window 51.2 ms long centred approximately over the mid point of the vowel. The 0 dB reference value has been selected so that all spectral information is displayed as having a negative dB amplitude. The frequency axis is in kiloHertz.
Further Reading
- Clark and Yallop, section 7.14, especially pp 259-264
Spectrograms: Time, Frequency and Intensity
A spectrograph is a machine or a computer algorithm that performs a series of spectral analyses at different times and then displays them using a three dimensional display of time, frequency and amplitude.
In most cases time is displayed on the X-axis, frequency is displayed on the Y-axis and amplitude is displayed as variations on greyscale darkness or of colour.
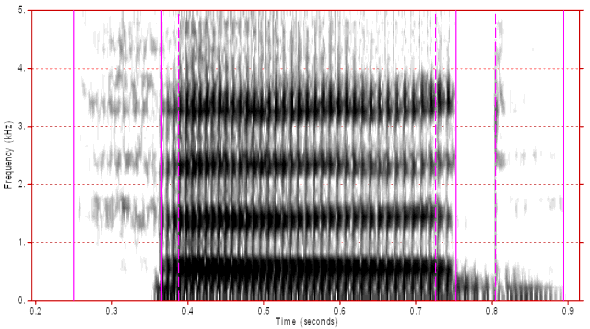
Figure 9: This is a broad band spectrogram of the word "heard" spoken by an adult male speaker of Australian English. Note that the time scale on the X-axis is in seconds and the frequency scale on the Y-axis is in kiloHertz. The darker bands represent the more intense components of the spectrum.
The spectrogram in figure 6 is a broad band spectrogram using BP filters with a bandwidth of about 300 Hz. This provides a good time resolution which shows vertical striations that represent the periodic opening and closing of the glottis.
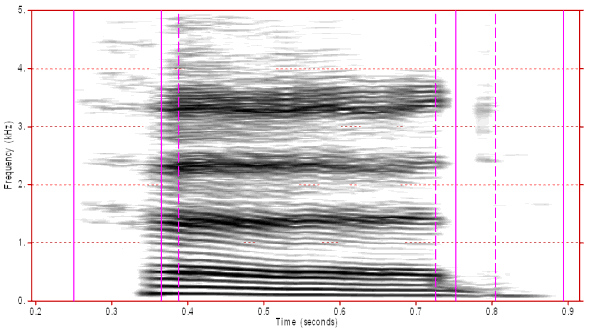
Figure 10: This is a narrow band spectrogram of the word "heard" spoken by an adult male speaker of Australian English.
The spectrogram in figure 7 is a narrow band spectrogram using BP filters with a bandwidth of about 45 Hz. This provides a good frequency resolution which shows horizontal striations that represent the harmonics of the spectrum.
Further Reading
- Clark and Yallop, section 7.14, especially pp 253-257
- Harrington and Cassidy, section 2.2.7, pp 24-28
Content owner: Department of Linguistics Last updated: 12 Mar 2024 10:11am
